Oil and natural gas: the price of oil falls below $72.50
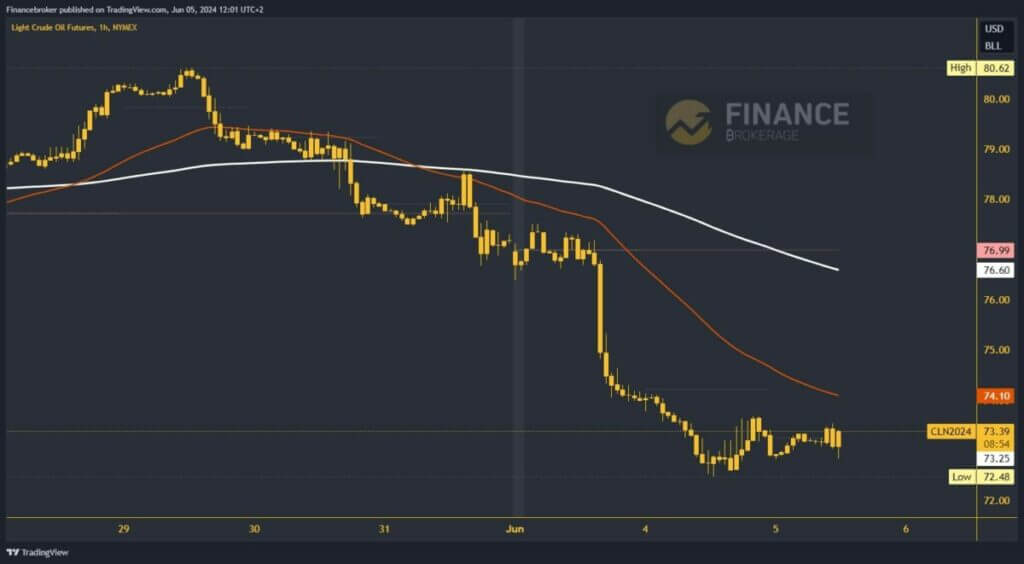
- Yesterday, the oil price retreated to a new weekly low of $72.48.
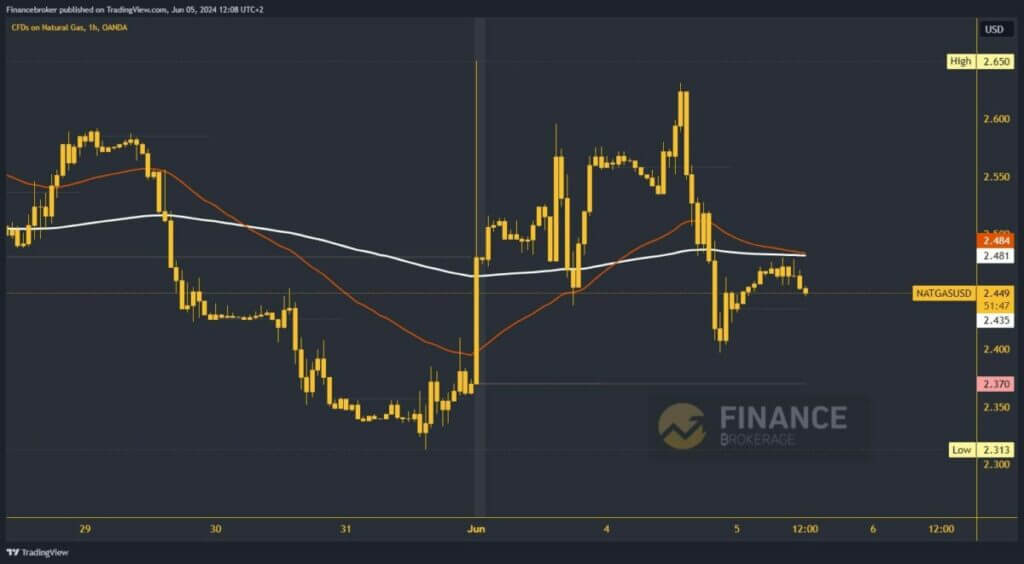
- The price of natural gas was under pressure yesterday after jumping to the $2.63 level.
Oil chart analysis
Yesterday, the oil price retreated to a new weekly low of $72.48. After that, the price managed to stop further decline and achieved a slight recovery to the level of $73.40. We need a stronger impulse that would push us to $74.00 and thus release the bearish pressure. In the $74.00 zone, we meet the EMA50 and expect its support for further recovery to the bullish side.
Potential higher targets are $75.00 and $76.00 levels. The EMA200 moving average is around the $76.60 level. We need a negative consolidation and pullback to the $72.50 support zone for a bearish option. If the pressure on that zone continues, we could easily see an impulse below to a new daily low. Potential lower targets are $72.00 and $71.50 levels.

Natural gas chart analysis
The price of natural gas was under pressure yesterday after jumping to the $2.63 level. After that we see a bearish consolidation up to the $2.40 level. There, we managed to stop the fall and start the morning recovery to the $2.48 level. In this zone, we encounter resistance in the EMA200 moving average and turn again to the bearish side. We must pay special attention to the daily open price at the $2.43 level.
Potential lower targets are $2.40 and $2.35 levels. For a bullish option, we need the initiation of a positive consolidation and a rise above the $2.50 level and the EMA200 moving average. Then, we would have to hold there to form a bottom for a continuation to the bullish side. Potential higher targets are $2.55 and $2.60 levels.

The post Oil and natural gas: the price of oil falls below $72.50 appeared first on FinanceBrokerage.

