

S&P 500 index and Nasdaq: May high for S&P 500 at 5240.0
- Yesterday, a new May high on the S&P 500 index was formed at the 5240.3 level.
- On Friday, the Nasdaq index rose to 18250.6, forming a May high there.
S&P 500 chart analysis
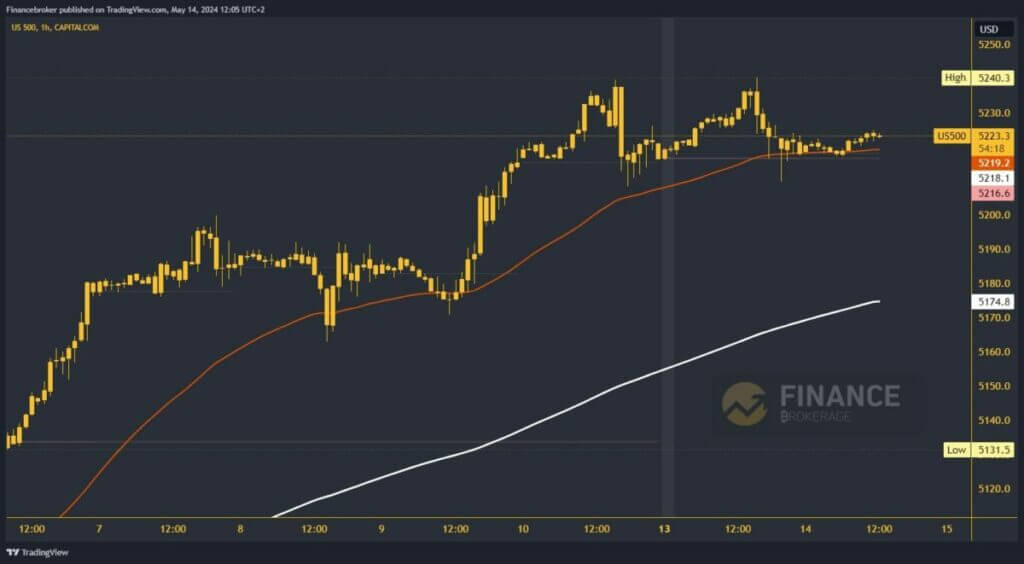
Yesterday, a new May high on the S&P 500 index was formed at the 5240.3 level. Until Friday, the index moves in the 5210.0-5240.0 range. During this morning’s Asian trading session, we find support at the lower level along with the EMA50 moving average. A mild bullish consolidation above the 5223.0 level has been initiated. Now, we are trying to hold above there in order to start a further recovery to the bullish side.
Potential higher targets are 5230.0 and 5240.0 levels. We need a negative consolidation and a drop below the 5215.0 weekly open price for a bearish option. This moves us into negative territory, strengthening the bearish momentum. Potential lower targets are 5200.0 and 5190.0 levels. EMA200 moving average is in the zone of 5175.0 levels.
Nasdaq chart analysis
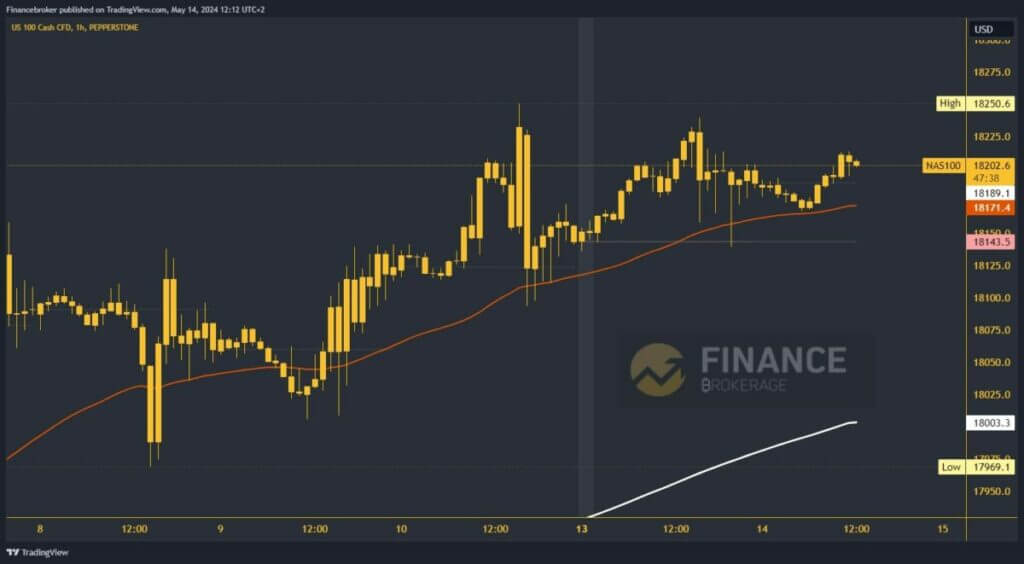
On Friday, the Nasdaq index rose to 18250.6, forming a May high there. Yesterday and today, the index moves in the 18150.0-18250.0 range. We received support from the EMA50 moving average this morning and are now at 18200.0. We expect to see a continuation up to 18250.0 and test previous highs. Potential higher targets are 18275.0 and 18300.0 levels.
We need a negative consolidation and a pullback below the EMA50 at the weekly open price for a bearish option. This puts pressure on the 18145.0 level. A bearish impulse would lead to a drop to a new low and thus confirm the presence of bearish momentum. Potential lower targets are 18125.0 and 18100.0 levels.
The post S&P 500 index and Nasdaq: May high for S&P 500 at 5240.0 appeared first on FinanceBrokerage.