S&P500 and Nasdaq Indices: Nasdaq is back above 18000.00
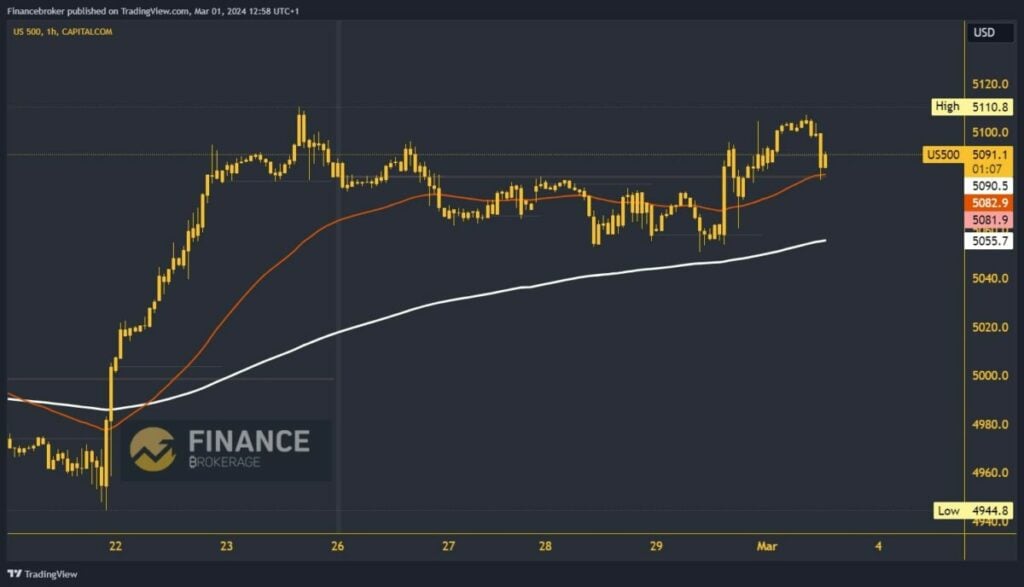
- The S&P500 index has been in retreat this week until the 5050.8 level yesterday morning.
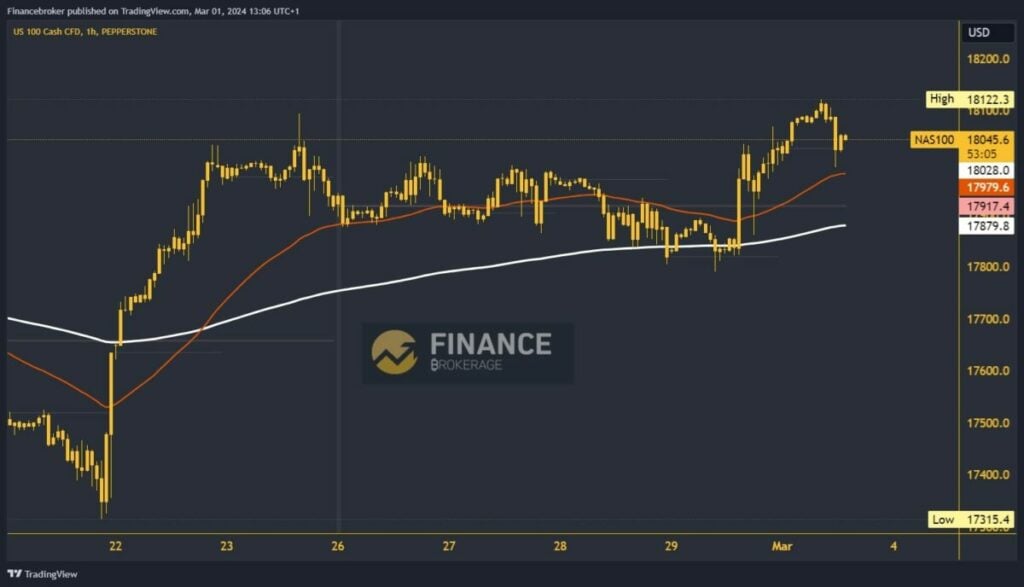
- The Nasdaq index was in a bearish trend this week until support at the 17800.0 level.
S&P500 index chart analysis
The S&P500 index has been in retreat this week until the 5050.8 level yesterday morning. At that level, we get support and first console ourselves in that zone. Shortly after that, we see a bullish impulse and a jump to the 5095.0 level. During the Asian trading session, we managed to climb up to 5107.4 levels and form the day high. There, we were very close to reaching last week’s high at the 5110.8 level.
From that level, the index retreated to 5090.0, where we test the weekly open price. If we manage to stay above, we will have a good chance to continue on the bullish side. Potential higher targets are 5100.0 and 5120.0 levels. We need a negative consolidation and pullback below the 5090.0 level for a bearish option. With that move, we are heading to the bearish side, and the potential lower targets are 5080.0 and 5060.0 levels. Additional support could be found in the EMA200 moving average at the 5050.0 level.

Nasdaq index chart analysis
The Nasdaq index was in a bearish trend this week until support at the 17800.0 level. There, we encountered the EMA200 moving average, which did not allow us to move below. This resulted in a bullish impulse on Thursday and a jump to the 18050.0 level. During the previous Asian trading session, the index climbed to a new all-time high at 18122.3.
We stop there and start a pullback to the 18000.0 level. For now, we managed to hold above and move up to the 18050.0 level. We are approaching the time of the beginning of the US session, in which a bullish impulse and a jump to a new high could occur. Potential higher targets are 18100.0 and 18150.0 levels.

The post S&P500 and Nasdaq Indices: Nasdaq is back above 18000.00 appeared first on FinanceBrokerage.
