Oil and natural gas: Oil goes down to the $76.00 level
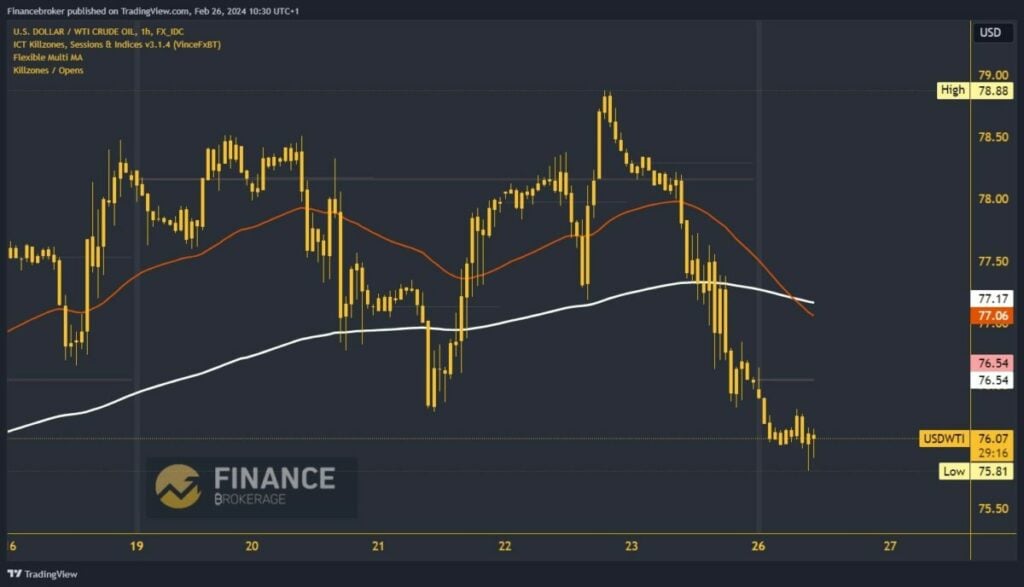
- The oil price is in a bearish trend after last week’s jump to $78.88.
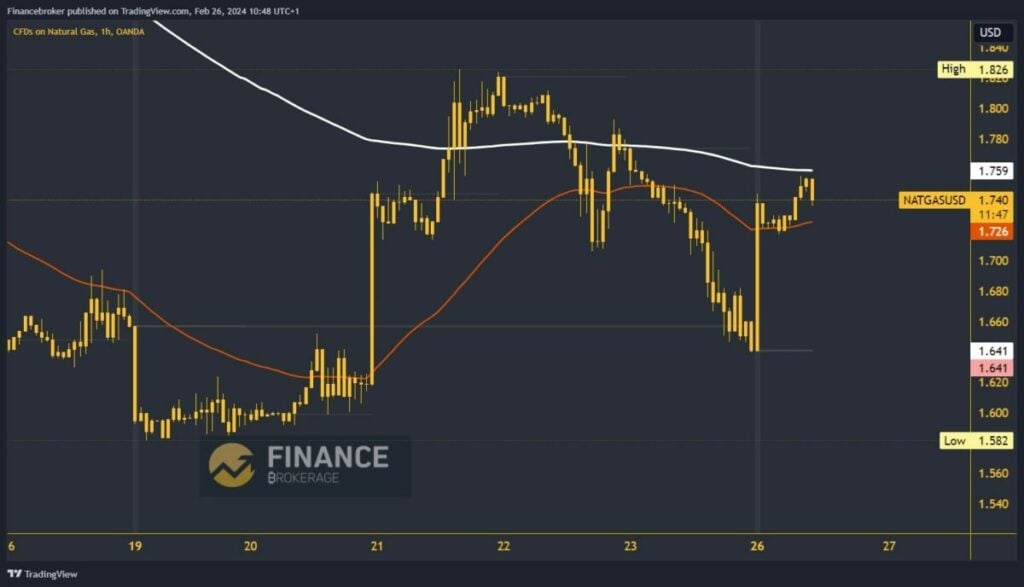
- At the beginning of the Asian trading session, the price of natural gas made a bullish gap and jumped to the $1.73 level.
Oil chart analysis
The oil price is in a bearish trend after last week’s jump to $78.88. The retreat continued during this morning’s Asian session below $76.50. The price dropped to $76.00, but the picture is such that we can only expect a continuation of the decline. Potential lower targets are $75.50 and $75.00 levels.
We need to stop this pullback and consolidate above the $76.00 level for a bullish option. After the formation of the bottom in that zone, we will have a new opportunity to start a positive consolidation and try to break $76.50, the price from the market opening last night. Potential higher targets are $77.00 and $77.50 levels. Additional possible resistance at $77.00 is the EMA200 moving average.

Natural gas chart analysis
At the beginning of the Asian trading session, the price of natural gas made a bullish gap and jumped to the $1.73 level. After that, we successfully stayed in that zone and progressed to the $1.76 level. Here, we now come across the EMA200 moving average and pause for a moment. We need an impulse that would move us above and make it easier for us to move further to the bullish side. Potential higher targets are $1.78 and $1.80 levels.
Last week’s high price of natural gas was at the $1.82 level. We need a price drop below the $1.72 support level for a bearish option. After that, we could see a pullback to Friday’s low and thus close the price imbalance. Potential lower targets are $1.66 and $1.64 levels.

The post Oil and natural gas: Oil goes down to the $76.00 level appeared first on FinanceBrokerage.
