SP&500 at new all time high while Nasdaq fell to 17315.4
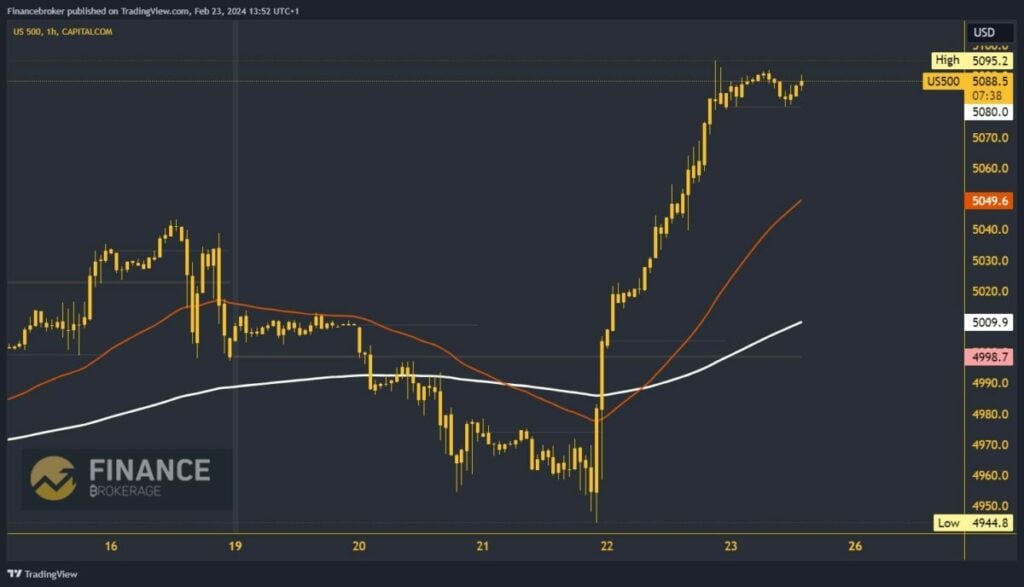
- From Monday to Wednesday, we watched the S&P 500 pull back to the 4944.8 support level.
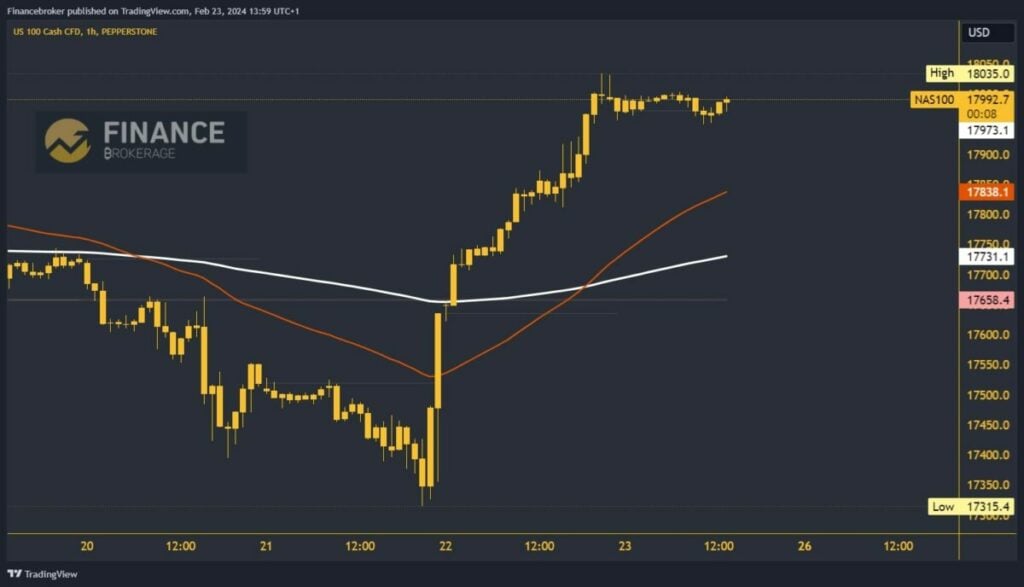
- The Nasdaq index was in retreat until Wednesday, when it fell to 17315.4.
S&P 500 index chart analysis
From Monday to Wednesday, we watched the S&P 500 pull back to the 4944.8 support level. After the new support, the index started a strong bullish impulse, which on Thursday evening took us up to 5095.2 levels, a new all-time high. During this morning’s Asian session, we managed to hold above the 5080.0 level. Now, we are waiting for the start of the US session, which could give a new impulse and push us to the 5100.0 level.
Potential higher targets are 5110.0 and 5120.0 levels. We need to break below today’s support at the 5080.0 level for a bearish option. Thus, we would first form a new daily low and indicate a possible increase in bearish momentum and a fall in the index. Potential lower targets are 5070.0 and 5060.0 levels.

Nasdaq index chart analysis
The Nasdaq index was in retreat until Wednesday, when it fell to 17315.4. This was followed by an ultra-fast recovery to the 17700.0 level. On Thursday, we saw the continuation of the bullish trend up to 18035.0, and we were close to reaching the previous high at 18041.3 level. During the Asian trading session, the index moves in the 17980.0-18000.0 range.
That movement continued in the EU session, we are now waiting for the US session, which could take the first step towards a new all-time high. Potential higher targets are 18050.0 and 18100.00 levels. We would have to pull back below the 17980.0 support level for a bearish scenario. That would reinforce the negative momentum and push the index value into a pullback. Potential lower targets are 17950.0 and 17900.0 levels.

The post SP&500 at new all time high while Nasdaq fell to 17315.4 appeared first on FinanceBrokerage.

