Bitcoin is losing its bullish momentum in the last two days
- On Wednesday, October 23, the Bitcoin price continued its previous sideways consolidation
Bitcoin chart analysis
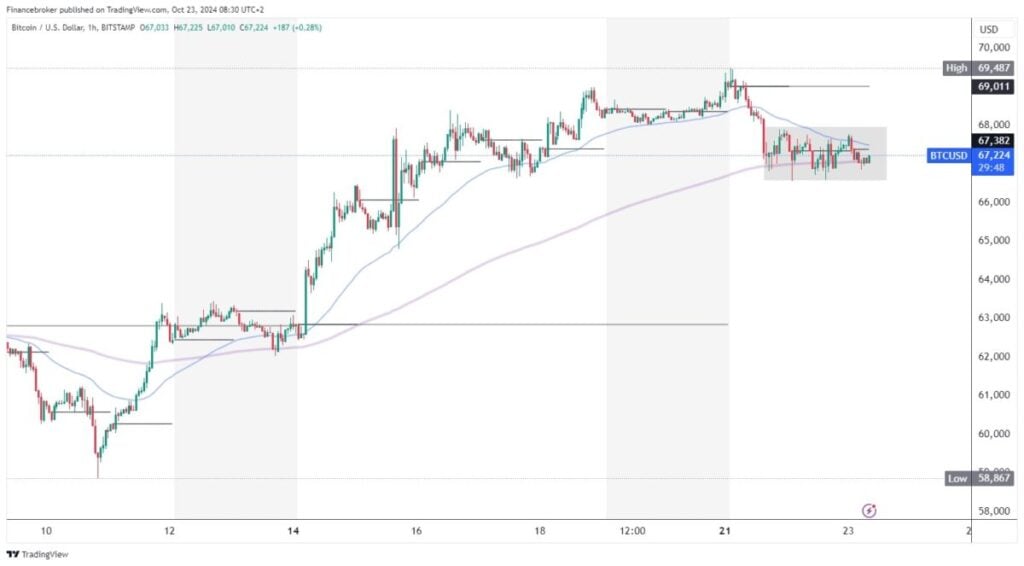
On Wednesday, October 23, the Bitcoin price continued its previous sideways consolidation. We see price pressure on the EMA 200 moving average for the second day. The bad thing for Bitcoin is that we don’t have a new high forming, which could pull the price to the bullish side. A jump to $68,000 should be the first indication that the momentum is waking up and that we are slowly turning to recovery.
After that, the following targets are $68500 and $69000 levels. At $69,000, the price will test the weekly open level. Depending on the movement in that zone, future trends will also depend. It is possible that we could have a new resistance to continue on the bullish side. Potential higher targets are $69500 and $70000 levels.

The price remains neutral, giving us no indication of where it will go in the coming period
For a bearish option, Bitcoin should make an impulse below the EMA 200, down to the $66500 level. With that move, we will test this week’s low before continuing with a further pullback. Strengthening the bearish momentum will increase the pressure on the price to form a new lower low and confirm the bearish trend. Potential lower targets are the $66,000 and $65,500 levels.
Options traders are placing significant bets that Bitcoin will hit a record high of $80,000 by the end of November, according to Bloomberg. Trump, an outspoken proponent of digital assets in the past month, is seen as a pro-crypto candidate. On the other hand, Harris has pledged to support a regulatory framework for cryptocurrencies, a move away from the tighter oversight seen during the Biden administration.
The post Bitcoin is losing its bullish momentum in the last two days appeared first on FinanceBrokerage.
