Who would have thought a mid-week break would halt the stock market’s winning streak? Maybe the hot PMI reading leaked, or traders and investors felt the stock market was getting so toppy that it was time to take some profits from the high flyers.
No Selloff Follow-Through
Thursday’s selloff impacted large-cap semiconductor stocks the most. NVIDIA, Inc. (NVDA) dropped over 3% and closed the week down just over 4%. Broadcom Inc. (AVGO) has been selling off since Tuesday, ending the week lower by 4.40%.
Click here for live chart.
Thursday’s selloff impacted large-cap semiconductor stocks the most. NVIDIA, Inc. (NVDA) dropped over 3% and closed the week down just over 4%. Broadcom Inc. (AVGO) has been selling off since Tuesday, ending the week lower by 4.40%.
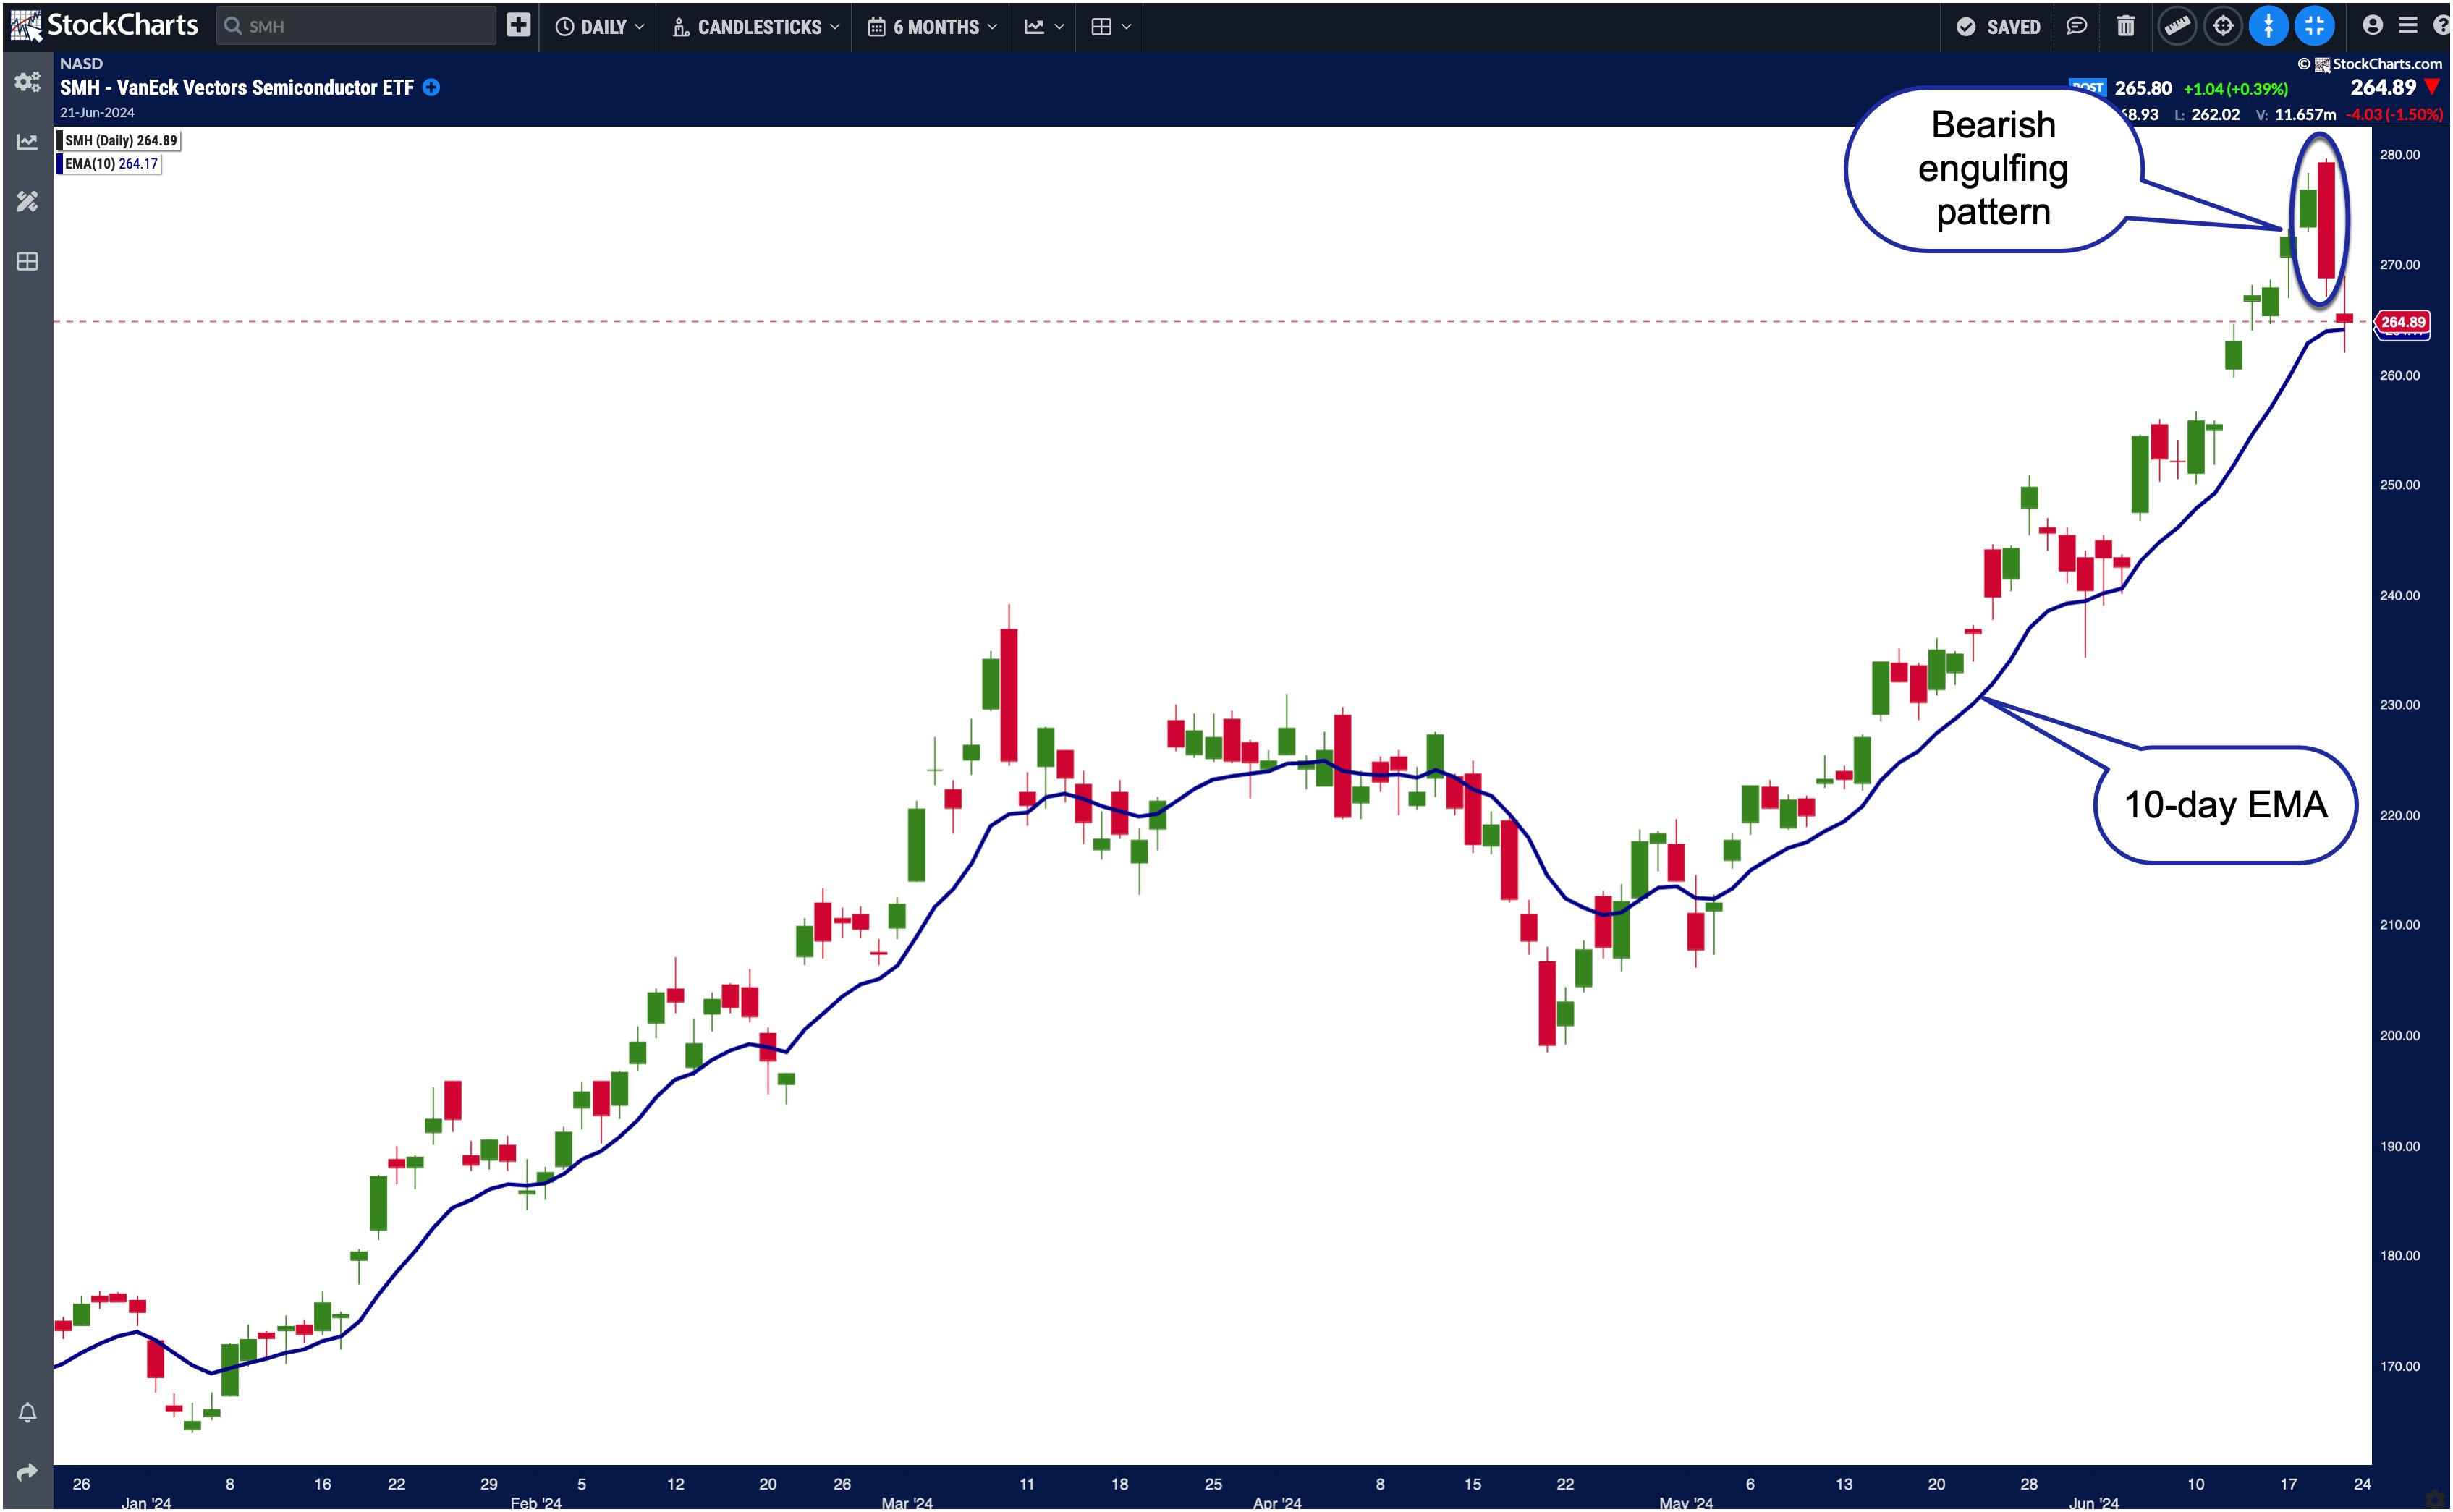
This semiconductor weakness can be seen in the VanEck Vectors Semiconductor ETF (SMH) chart below.

CHART 1. DAILY CHART OF THE VANECK SEMICONDUCTOR ETF (SMH). The bearish engulfing pattern was an indication that further selling is likely to take place, and a reversal could be on the horizon. However, SMH managed to hold on to its 10-day EMA.Chart source: StockChartsACP. For educational purposes.
SMH closed barely above its two-week exponential moving average (EMA). An important point to note is that Thursday closed with a bearish engulfing pattern. It’s only natural for technical analysts to think that the selloff would continue into Friday. It did initially, but reversed, closing with a candlestick that resembled a doji. This indicates investor indecision.
Overall, Friday’s price action was relatively quiet, a surprise after the previous day’s selloff and for a quadruple witching day. This indicates that investors aren’t rushing to sell off just yet. The stock market is still very bullish, for good reason. There have been no signs of any slowing down in economic activity.
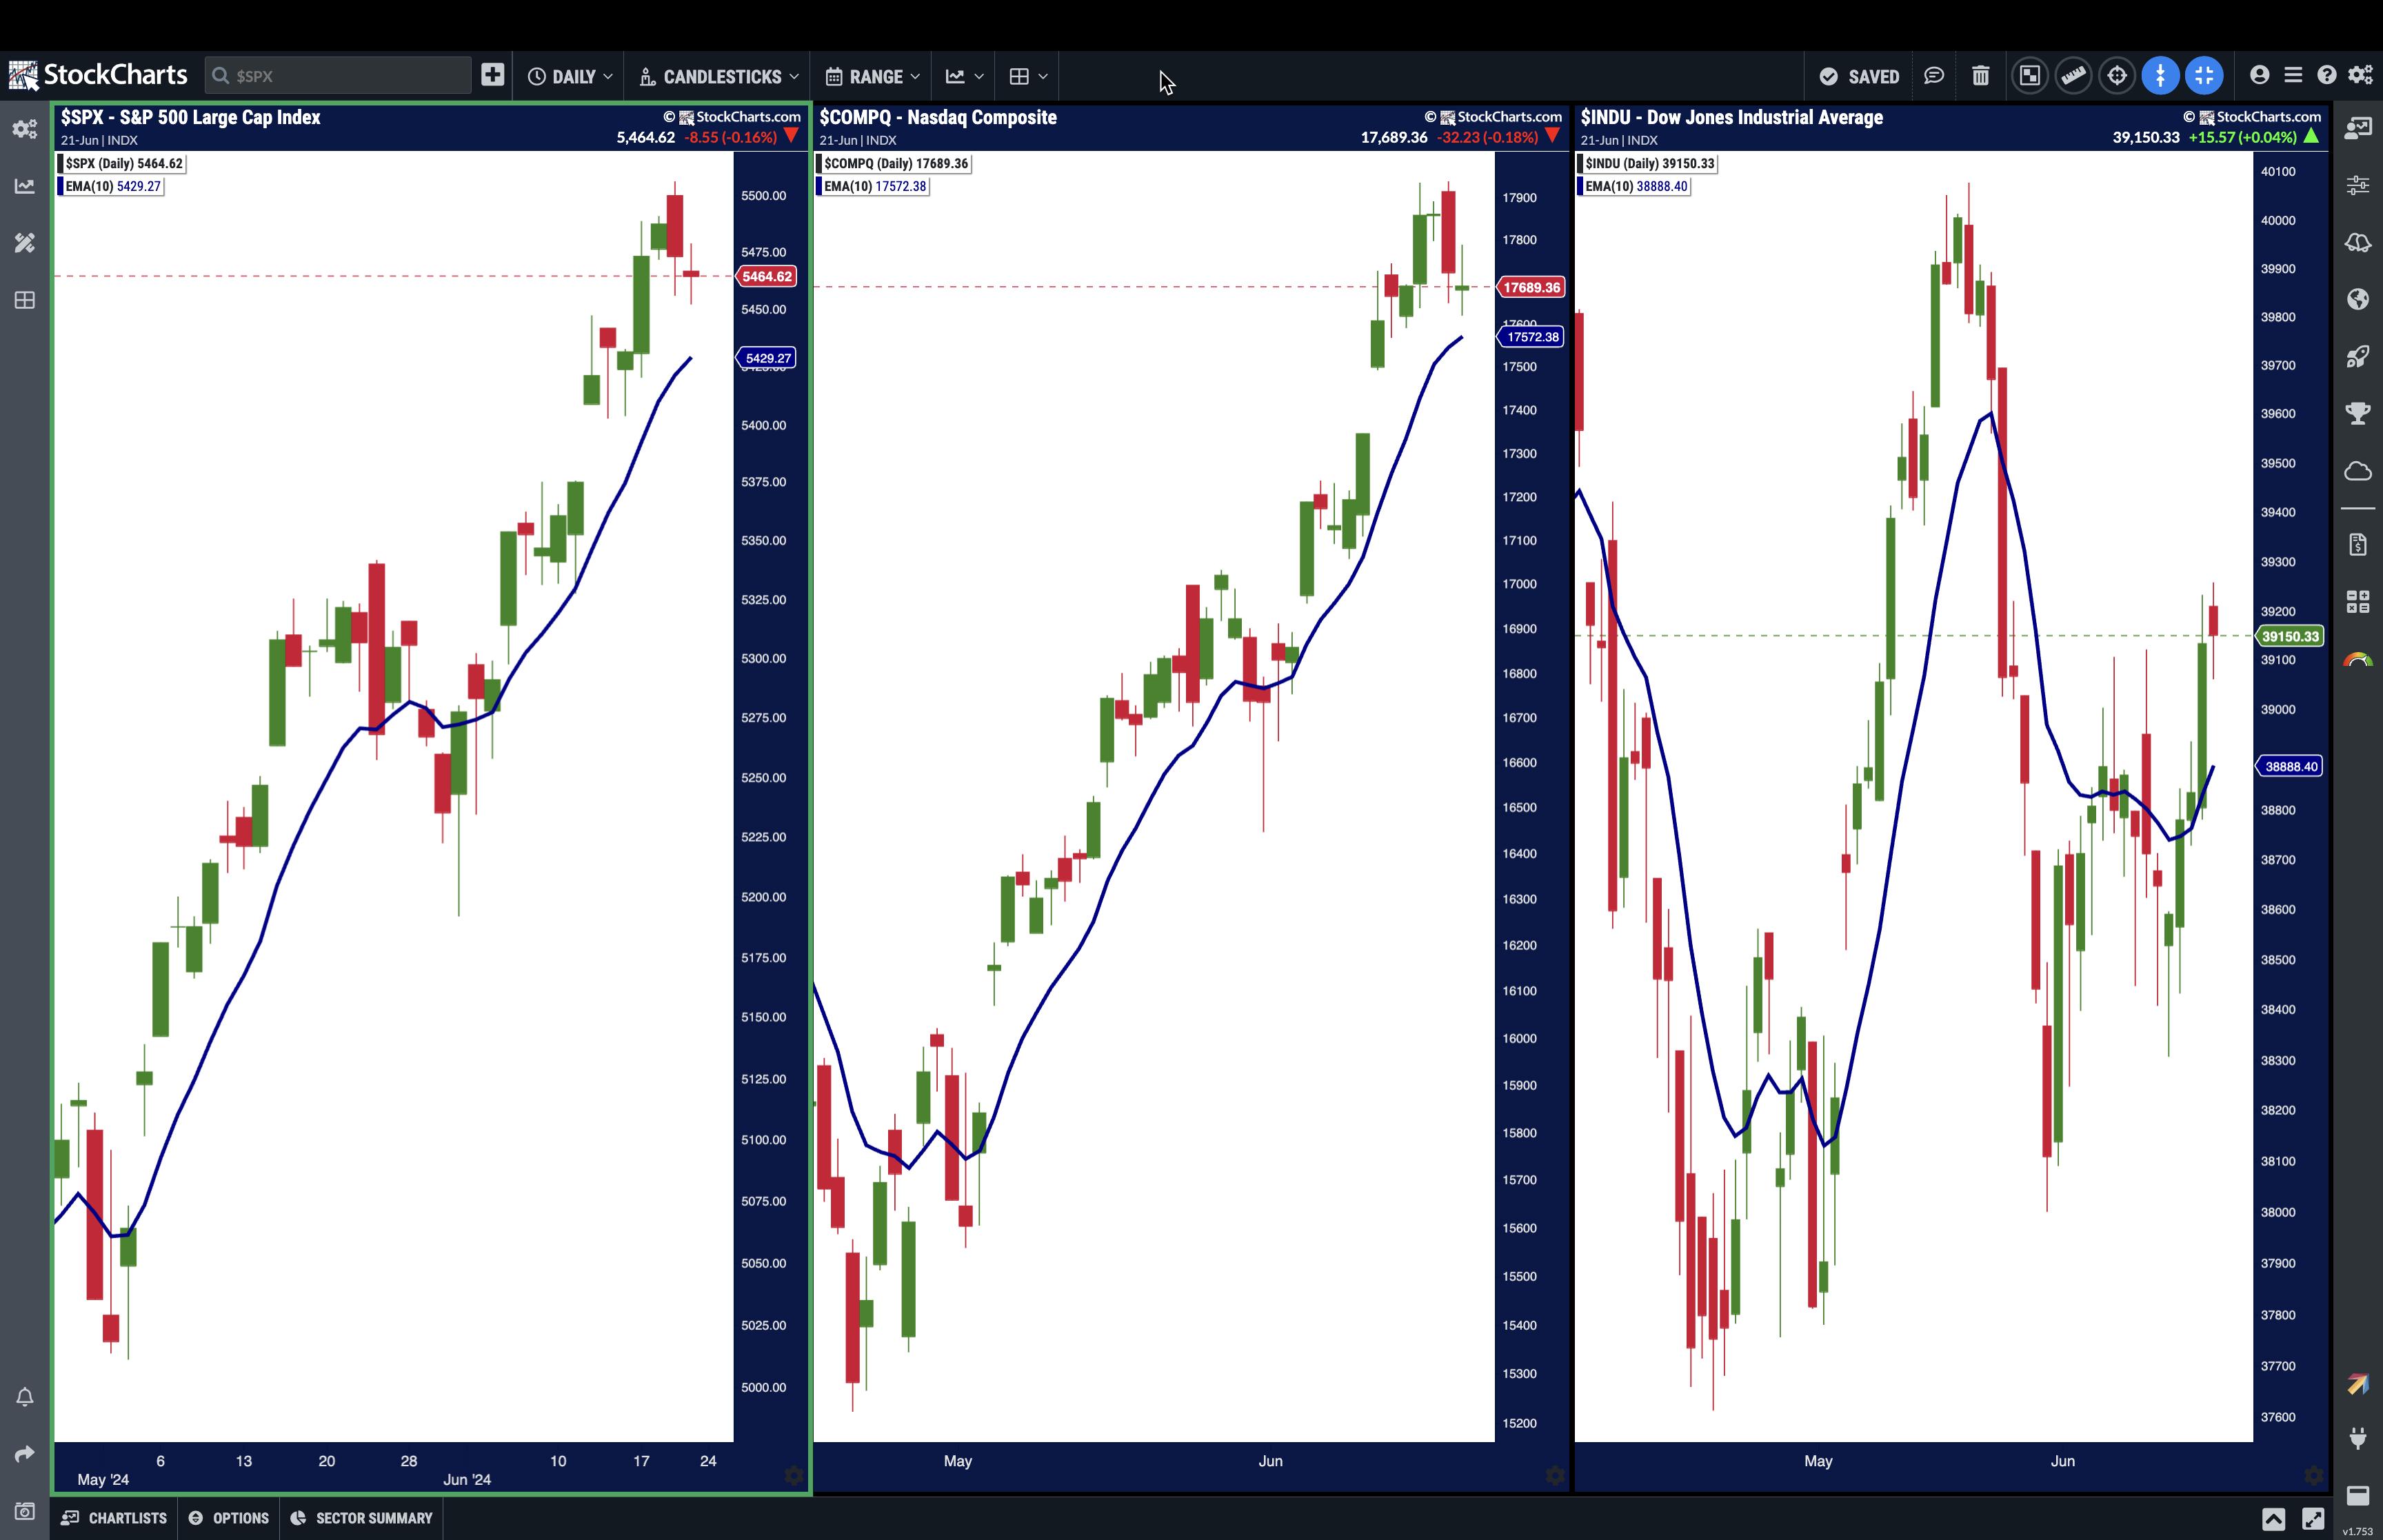
If you look at a short-term moving average, such as a two-week (10-day) EMA, it’s clear that the S&P 500 has been trading above it for most of June. The Nasdaq Composite ($COMPQ) displays a similar picture.
Click here for live chart.
Overall, both indexes look like their strong uptrend is intact. The Dow Jones Industrial Average ($INDU) is the one that has struggled lately, although it closed above its 10-day EMA on Thursday and Friday.

CHART 2. DAILY CHARTS OF S&P 500, NASDAQ COMPOSITE, AND DOW JONES INDUSTRIAL AVERAGE. All three indexes have the legs to carry the bull run further.Chart source: StockChartsACP. For educational purposes.
Nothing has changed the bullish sentiment of the stock market. While semiconductor stocks sold off, stocks in other sectors did well. Healthcare stocks such as Gilead Sciences, Inc. (GILD), Sarepta Therapeutics, Inc. (SRPT), and Zealand Pharma (ZLDPF) saw strong gains.
All Quiet On the Weekly Front
There’s not much economic data next week except for the PCE. The bigger attraction will probably be Micron Technology, Inc (MU) earnings. The stock had a nice run from mid-April until Thursday, when it plunged hard following its semiconductor cousins. Wall St. analysts expect $0.51 earnings per share and revenues of $6.66 billion. If MU beats estimates, it could boost tech stocks. Investors who missed out on the chip rally may have an opportunity to buy on the semiconductor dip if MU delivers. Micron announces earnings on Wednesday after the close. It’s all about timing!
Bonds were relatively flat this week after last week’s strong rally. Overall, the uptrend is still in play, with a series of higher highs and higher lows. It’s probably not time to invest in the bond market, but it’s worth watching the price action. It can often act as a leading indicator if it shows a strong move in either direction.
The bottom line: Next week, watch Micron’s earnings results on Wednesday after the close and Friday’s PCE number.
End-of-Week Wrap-Up

- S&P 500 closes up 0.61% for the week, at 5464.62, Dow Jones Industrial Average down 1.45% for the week at 39,150.33; Nasdaq Composite closed flat for the week; down 0.23% at 17,689.36.
- $VIX up 4.72% for the week at 13.20
- Best performing sector for the week: Consumer Discretionary
- Worst performing sector for the week: Utilities
- Top 5 Large Cap SCTR stocks: NVIDIA (NVDA); Super Micro Computer, Inc. (SMCI); MicroStrategy Inc. (MSTR); Vistra Energy (VST); Sea Ltd. (SE)
On the Radar Next Week
- April Case-Shiller Home Price
- May New Home Sales
- May Durable Goods Orders
- Q1 Final GDP Index
- May PCE Price Index
- Micron Technology earnings
Disclaimer: This blog is for educational purposes only and should not be construed as financial advice. The ideas and strategies should never be used without first assessing your own personal and financial situation, or without consulting a financial professional.


