Oil and natural gas: natural gas rises to the $2.45 level
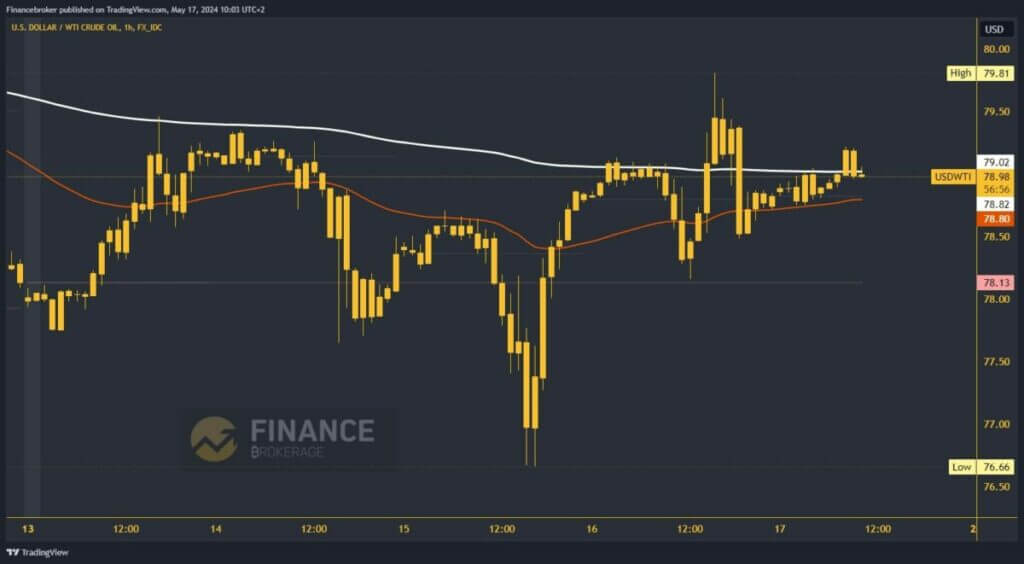
- On Wednesday, the oil price fell to the $76.66 level, forming a new weekly low there.
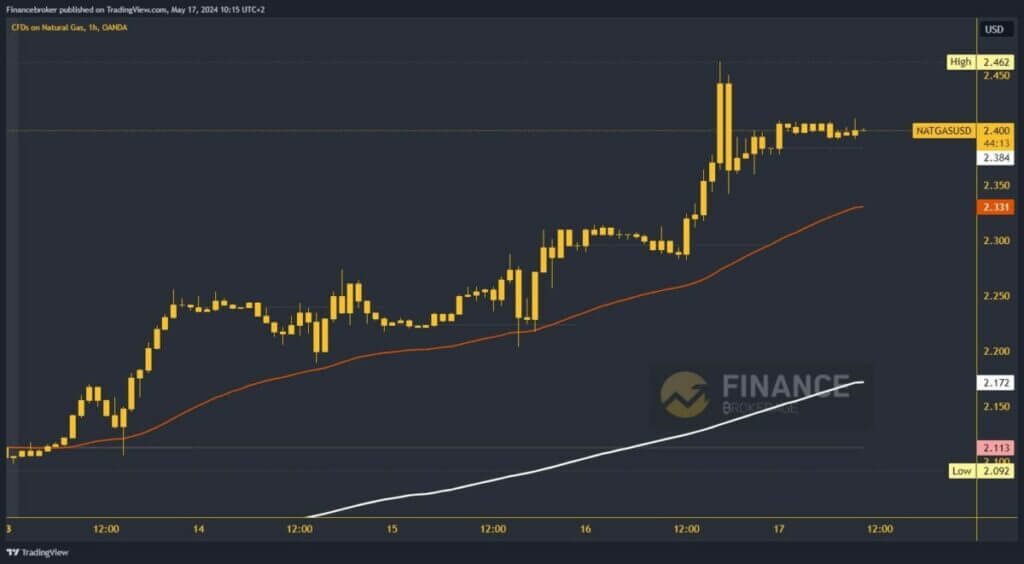
- The price of natural gas climbed to a new May high yesterday at the $2.46 level.
Oil chart analysis
On Wednesday, the oil price fell to the $76.66 level, forming a new weekly low there. After that, we managed to stabilize down there and, from there, started a bullish consolidation that took us up to the $79.81 level yesterday. We were very close to reaching the $80.00 level. Unfortunately, the price had no strength, and a pullback to new support at $78.50 followed.
During this morning’s Asian trading session, the oil price recovered slightly to $79.20 and returned above the EMA200 moving average. We are now hovering around $79.00 and testing the moving average. We need a new impulse to take us above $79.50 to start a bullish momentum. After that, we can expect to embark on a more concrete recovery. Potential higher targets are $80.00 and $80.50 levels.

Natural gas chart analysis
The price of natural gas climbed to a new May high yesterday at the $2.46 level. Shortly after that, we saw a pullback to the $2.35 level. There, we get new support and start a bullish consolidation. During this morning’s Asian trading session, the price moved in the $2.38-$2.41 range. Currently, we are still in that zone with a slight bullish touch since we are above the daily open price.
We need an impulse to the $2.42 level to trigger a bullish rally. Potential higher targets are $2.45 and $2.50 levels. For a bearish option, we need a pullback below the daily open price at $2.38. Below that, we go to a new daily low and confirm the initiation of bearish momentum. Potential lower targets are $2.35 and $2.30 levels.

The post Oil and natural gas: natural gas rises to the $2.45 level appeared first on FinanceBrokerage.

