S&P 500 slips below 5000.0, Nasdaq stopped the April agony
- After less than two months, the S&P 500 retreated below the 5000.0 level.
- Nasdaq stopped the April agony this morning at the 17037.3 level.
S&P 500 chart analysis
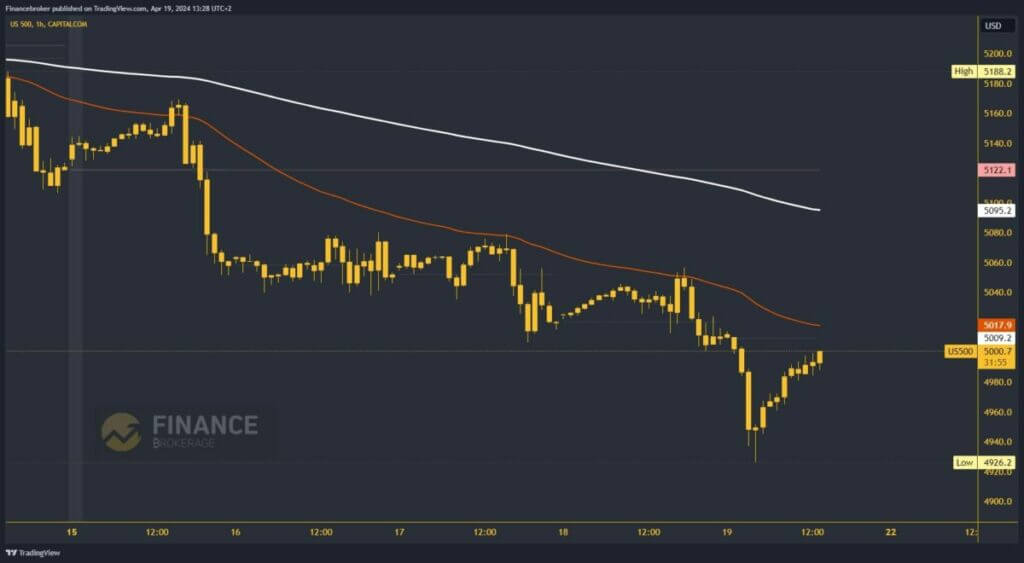
After less than two months, the S&P 500 retreated below the 5000.0 level. This morning, we saw a new low at the 4926.2 level. After that, a positive consolidation up to the 5000.0 level was initiated. The daily open price is 5009.0, and we need to move above it to return to the positive side. Additional pressure is exerted by the EMA50 moving average in that zone, which could be a problem for further recovery.
If we manage to jump over that resistance level, we will be able to start a further recovery. Potential higher targets are 5020.0 and 5040.0 levels. We need a negative consolidation and pullback below the 4980.0 level for a bearish option. This would start the pullback and turn towards the previous low. Potential lower targets are 4960.0 and 4940.0 levels.

Nasdaq chart analysis
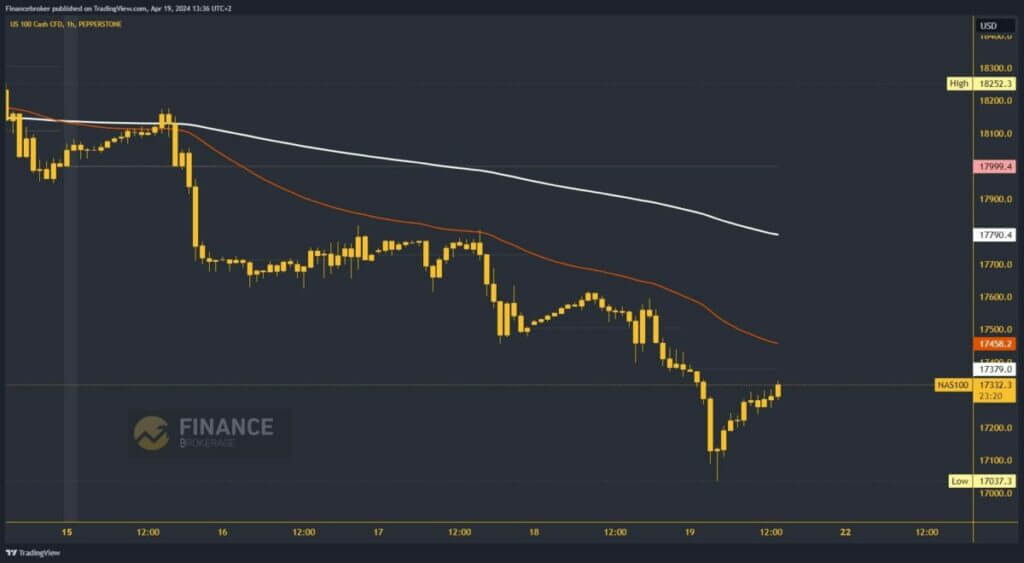
Nasdaq stopped the April agony this morning at the 17037.3 level. The previous time we were at this level was on January 19. The index gains new support at that level and initiates a recovery to the 17340.0 level. Moving above 17380.0 we return to the positive side above the weekly open price. If we stay up there, we could form a bottom for continuation to the bullish side.
Potential higher targets are 17500.0 and 17600.0 levels. We need a negative consolidation and pullback below the 17200.0 level for a bearish option. With that step, we turn again to the bearish side. The Nasdaq will then be forced to continue its decline and look for a new support level. Potential lower targets are 17100.0 and 17000.0 levels.

The post S&P 500 slips below 5000.0, Nasdaq stopped the April agony appeared first on FinanceBrokerage.

