Meta Platforms Inc. (META), the social media giant formerly known as Facebook, has been in tight consolidation at the top of its range for a little over a month. Following a 23% rise in February after its Q4 earnings, trading volume for the stock has declined significantly. Market participants are now looking for any catalyst that could guide the stock’s movement.
Analyst Price Predictions Show Wide Variation
If you’re undecided as to whether you’re bullish or bearish on Meta, you’re not alone, as the blogosphere will show you a wide range of analyst price predictions for the next 12 months. The highest price target is at $610, average consensus is at $489, and the lowest price targets average around $272.
Yet, consensus ratings lean from “Buy” to “Strong Buy.”
What’s New with Meta? It’s New AI Rollout
The bullish outlook is driven by its new AI app, Meta AI, which aims to boost user engagement across WhatsApp, Instagram, Facebook, and Messenger by providing advanced AI capabilities such as animations and image generation. Supported by partnerships with Alphabet (GOOGL) and Microsoft (MSFT), Meta AI will likely see ad revenue growth, prompting analysts to raise their stock price targets.
A Macro Look at Meta

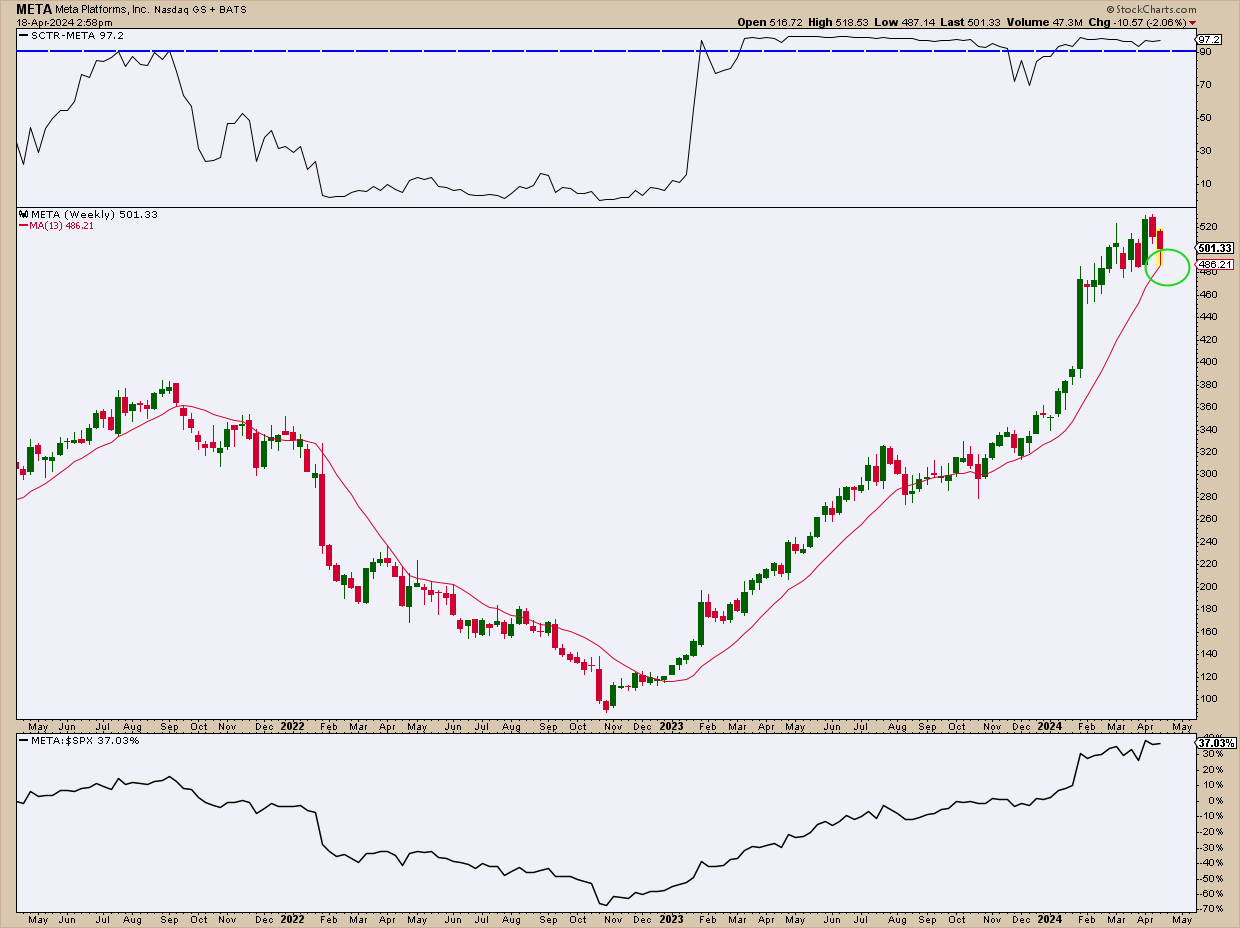
CHART 1. WEEKLY CHART OF META. Hovering at record highs, Meta’s uptrend appears to be leaning toward the parabolic side of things, prompting investors to wonder whether such a trajectory is sustainable. The 13-week SMA represents one quarter.Chart source: StockCharts.com. For educational purposes.
Having gone the distance to bounce off its 2022 lows, Meta began outperforming the S&P 500 just this year, now besting the broader market by 37%.
However, before even matching the broader market. Meta’s technicals—as shown by its StockCharts Technical Rank (SCTR) score—have been remarkably strong (with a score above the 90-line) since the end of 2022.
The 13-week simple moving average, representing one quarter, appears to be a consistent proxy for support and resistance. You will want to watch that line when looking at Meta using a weekly chart.
A Near-Term View of Meta’s Price Action
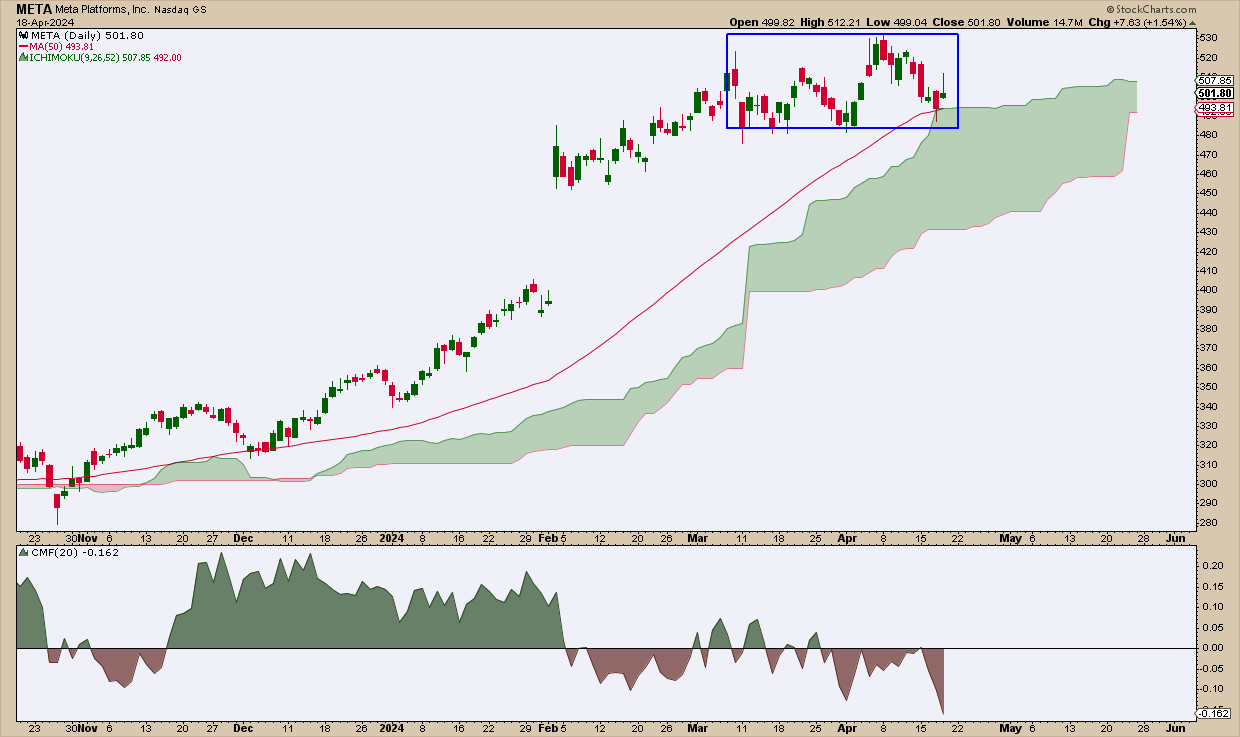
Analyst consensus may be largely bullish, and the Meta AI rollout is prompting Wall Street to raise price targets upward, with some going as high as $610. However, right now, we’re seeing a rectangle pattern and, technically, Meta’s price can go either direction, at least in the near term (see chart below).

CHART 2. DAILY CHART OF META. The momentum, or lack thereof, says a lot. Investors are probably waiting for the META’s next earnings report, scheduled for April 24.Chart source: StockCharts.com. For educational purposes.
Mind the Rectangle: If you’re looking to take action upon a breakout, set a price alert at $481 near the bottom and $531 near the top of the formation.

Mind the Momentum: Fundamental forecasts may be bullish, but the Chaikin Money Flow (CMF) will tell you that selling pressure is currently far greater, though there isn’t that much activity, bullish or bearish, taking place right now. And why not?
Earnings Coming Up: Meta’s last earnings report catapulted the stock to record highs. The next earnings date is on April 24. You’ll likely see more activity occurring close to Meta’s earnings date. So pay close attention to this.
Support Levels: If Meta’s earnings are so-so but not bad enough to invalidate its longer-term bullish thesis (AI rollout), or if its price breaks below the current rectangle formation and the 50-day simple moving average (causing it to trade technically toward the downside), then note the wide support range projected via the Ichimoku Cloud. If the bullish fundamental thesis holds out, buyers will likely jump in within the cloud.
The Bottom Line
Meta’s long-term prospects look bullish, much of which is being driven by the optimistic expectations surrounding its AI rollout, Meta AI. Still, it seems poised for a correction, though its chart formation indicates it can go either way. Watch out for any catalysts that could influence the stock’s trajectory as the next earnings date approaches. And if Meta does take a dip, keep an eye on that cloud, should the bullish fundamental outlook persist.
Disclaimer: This blog is for educational purposes only and should not be construed as financial advice. The ideas and strategies should never be used without first assessing your own personal and financial situation, or without consulting a financial professional.

