Dogecoin pullback from 0.19000, Shiba Inu found resistance
- The recent price action of Dogecoin and Shiba Inu has attracted significant attention from traders, with both cryptocurrencies experiencing notable movements in the market.
Dogecoin chart analysis
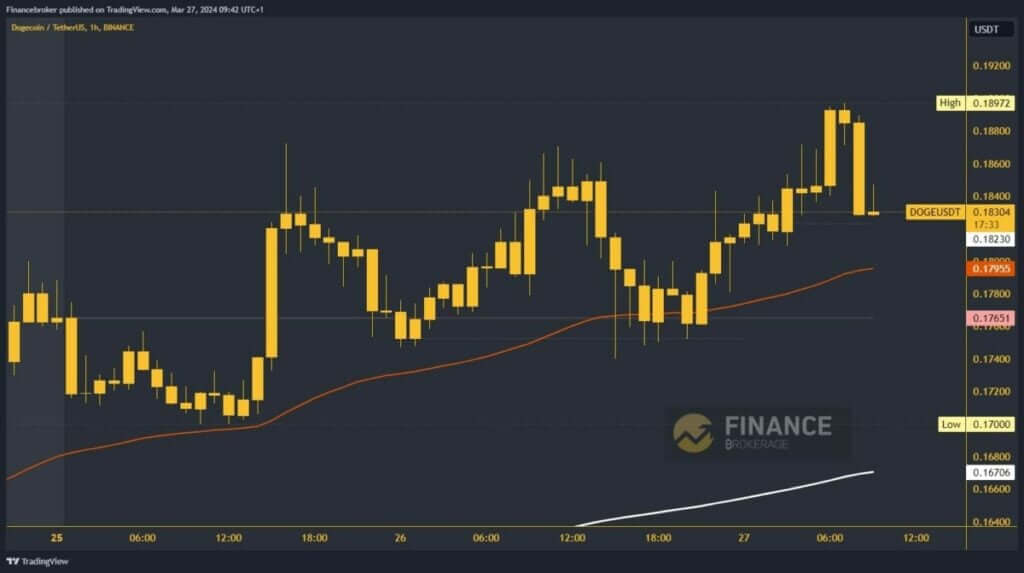
Starting with Dogecoin, the price surged to a fresh weekly high earlier today, reaching the 0.18972 level. Presently, Dogecoin appears to be in a stable bullish consolidation phase. Notably, yesterday’s pullback illustrated the strength of support around the weekly open price at the 0.17650 level. This support acted as a springboard for a bullish resurgence, propelling Dogecoin to its weekly high. Currently, resistance around this level is evident, leading to a retreat towards the 0.18270 support zone.
Market participants are eyeing the daily open price for potential support, anticipating another bullish consolidation phase. A breakthrough above the 0.18800 level could signal a test of previous highs, with targets set at 0.19000 and 0.19200. Conversely, a bearish scenario would entail a negative consolidation, possibly dipping below the daily open price. In such a case, support levels at 0.18000 and the EMA50 moving average become crucial. A breach below could lead to a retest of the weekly open price.

Shiba Inu chart analysis
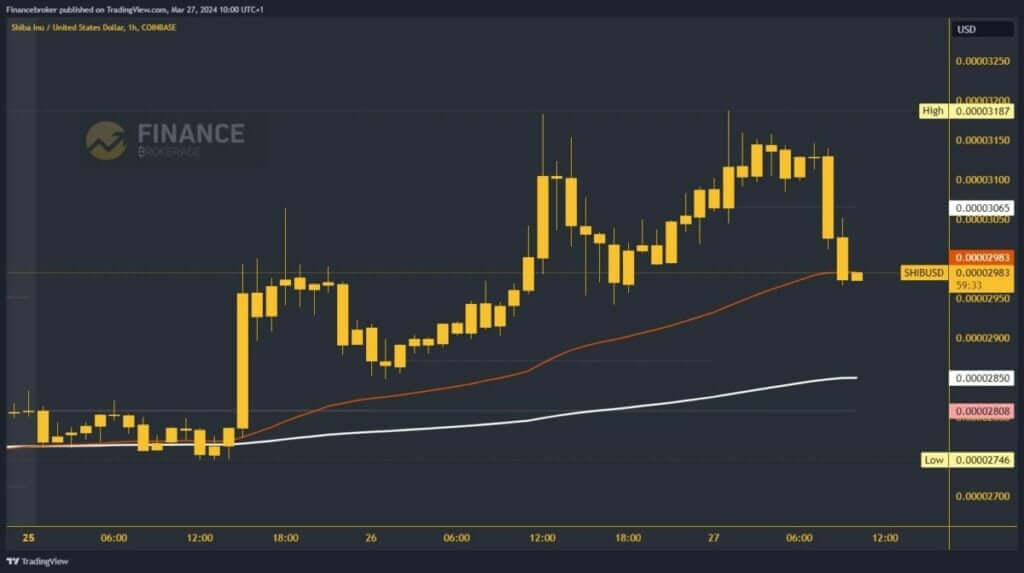
Turning to Shiba Inu, the cryptocurrency attempted to establish a new weekly high earlier today but encountered resistance around the 0.00003187 level. Subsequently, a pullback ensued, bringing the price down to the 0.00003000 mark. Here, the EMA50 moving average provided support, stabilizing the price for the time being. Staying above this level could pave the way for a bullish reversal and the initiation of a positive consolidation phase.
Potential higher targets for Shiba Inu include 0.00003100 and 0.00003200 levels. Conversely, a bearish scenario would involve a negative consolidation, resulting in a drop below the EMA50 moving average. Such a move would confirm a loss of bullish momentum, potentially leading to lower targets at 0.00002900 and 0.00002850, with additional support found in the latter zone, coinciding with the EMA200 moving average.

In summary, both Dogecoin and Shiba Inu are navigating crucial support and resistance levels, with traders closely monitoring these thresholds for indications of future price movements.
The post Dogecoin pullback from 0.19000, Shiba Inu found resistance appeared first on FinanceBrokerage.
