Oil and natural gas: Natural gas at $1.90 support level
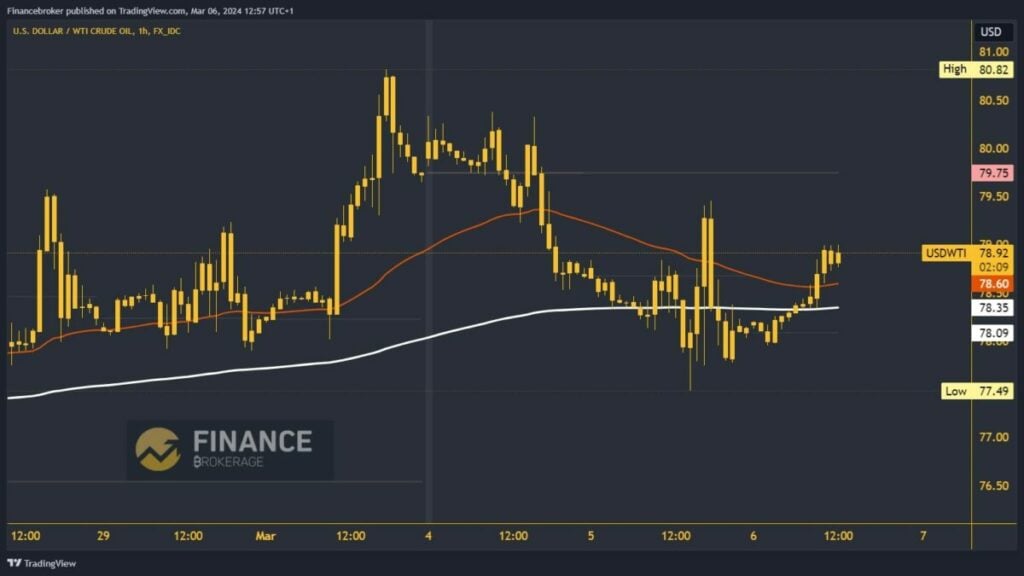
- The oil price fell to $77.49 yesterday, forming a new weekly low.
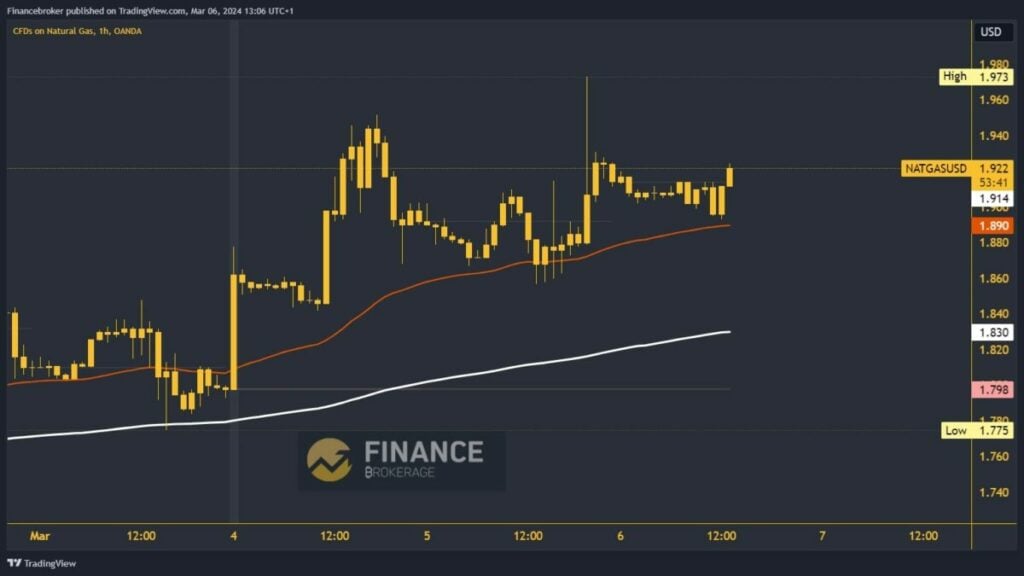
- This week, we see the continuation of the bullish trend in the price of natural gas up to the $1.97 level.
Oil chart analysis
The oil price fell to $77.49 yesterday, forming a new weekly low. There we find new support and start a recovery that continues today. During the Asian trading session, the oil price exceeded the $78.00 level and is on the verge of reaching the $79.00 level. After that, we look at $79.50, yesterday’s high as the next target.
If we get hold of it, we will have the opportunity to visit the weekly open price at the $79.75 level. Above, we are very close to the $80.00 level, and potential higher targets are the $80.50 and $81.00 levels. We need a price pullback below $78.00 and the EMA200 moving average for a bearish option. Thus, we return to bearish territory with the aim of falling to a new low. Potential lower targets are $77.50 and $77.00 levels.

Natural gas chart analysis
This week, we see the continuation of the bullish trend in the price of natural gas up to the $1.97 level. After that, the price retreated to support at the $1.89 level. Here, we expect to form a higher low and, from there, continue to the bullish side. We have the support of the EMA50 moving average, and this gives us additional confidence for further growth. Potential higher targets are the $1.94 and $1.96 levels.
We need a negative consolidation and a drop below the $1.89 support level for a bearish option. In this way, we turn to the bearish side, and the price will be forced to retreat. Potential lower targets are $1.88 and $1.86 levels. The EMA200 moving average is still slightly lower at the $1.84 level.

The post Oil and natural gas: Natural gas at $1.90 support level appeared first on FinanceBrokerage.

