Gold Market Updates: From $2032 to $2039 in a Single Day
- On Monday, we watched the price of gold pull back to the 2015$ level.
- Since the beginning of this week, silver prices have been in constant retreat.
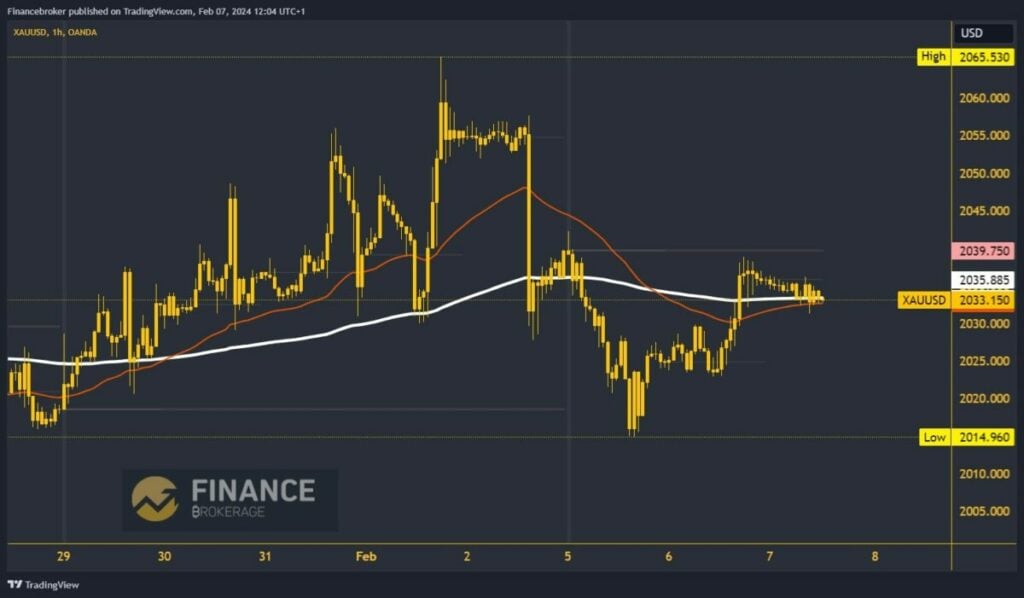
Gold chart analysis
On Monday, we watched the price of gold pull back to the 2015$ level. After successfully gaining support, the decline stopped there, and gold is initiating a bullish consolidation. We returned above the $2020 level very quickly, which on Tuesday represented support for further recovery. By the end of the day, the positive consolidation raised the price of gold to $2039.
During the previous Asian trading session, the price of gold was in a slight retreat, falling to the $2032 level. We are currently testing the EMA200 moving average here and watching how the price moves around it. A longer hold in that zone could break below and send the price of gold to a new daily low. Potential lower targets are $2030 and $2025 levels.

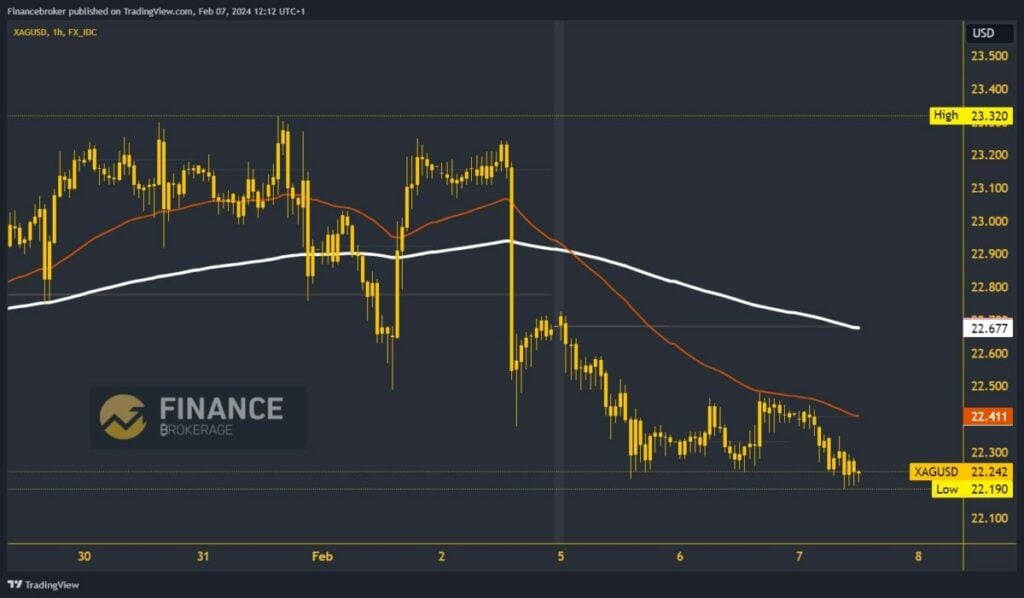
Silver chart analysis
Since the beginning of this week, silver prices have been in constant retreat. We started at $22.67 and are now at the $22.23 level. During the Asian trading session, the price slipped below $22.40 and continued to fall all the way to the $22.19 level. For now, we are maintaining above that level, but we are still close to the support zone. This could lead to a breakout below and the formation of a new weekly low.
Potential lower targets are $22.10 and $22.00 levels. We need to initiate a positive consolidation and a return above the $22.50 level for a bullish option. Thus, we would eliminate the previous loss and move away from the bearish zone. The price would have to hold above $22.50 if it plans to start a further recovery. Potential higher targets are $22.60 and $22.70 levels.

The post Gold Market Updates: From $2032 to $2039 in a Single Day appeared first on FinanceBrokerage.

