September’s strong labor market—336,000 jobs added—initially shocked investors. Treasury yields and the US Dollar Index ($USD) spiked higher, while equity futures dropped.
But a comeback attempt was in play. During the trading day, Treasury yields came off their highs, and the stock market came off its lows, closing positively. Investors weren’t panicked, as is evident in the CBOE Volatility Index ($VIX), which remained below 20.
Does a strong close in the major indexes mean the market has turned around? One day doesn’t make a trend, so we’re not out of the woods yet. But it’s an encouraging sign.
S&P 500 Close to Key Support
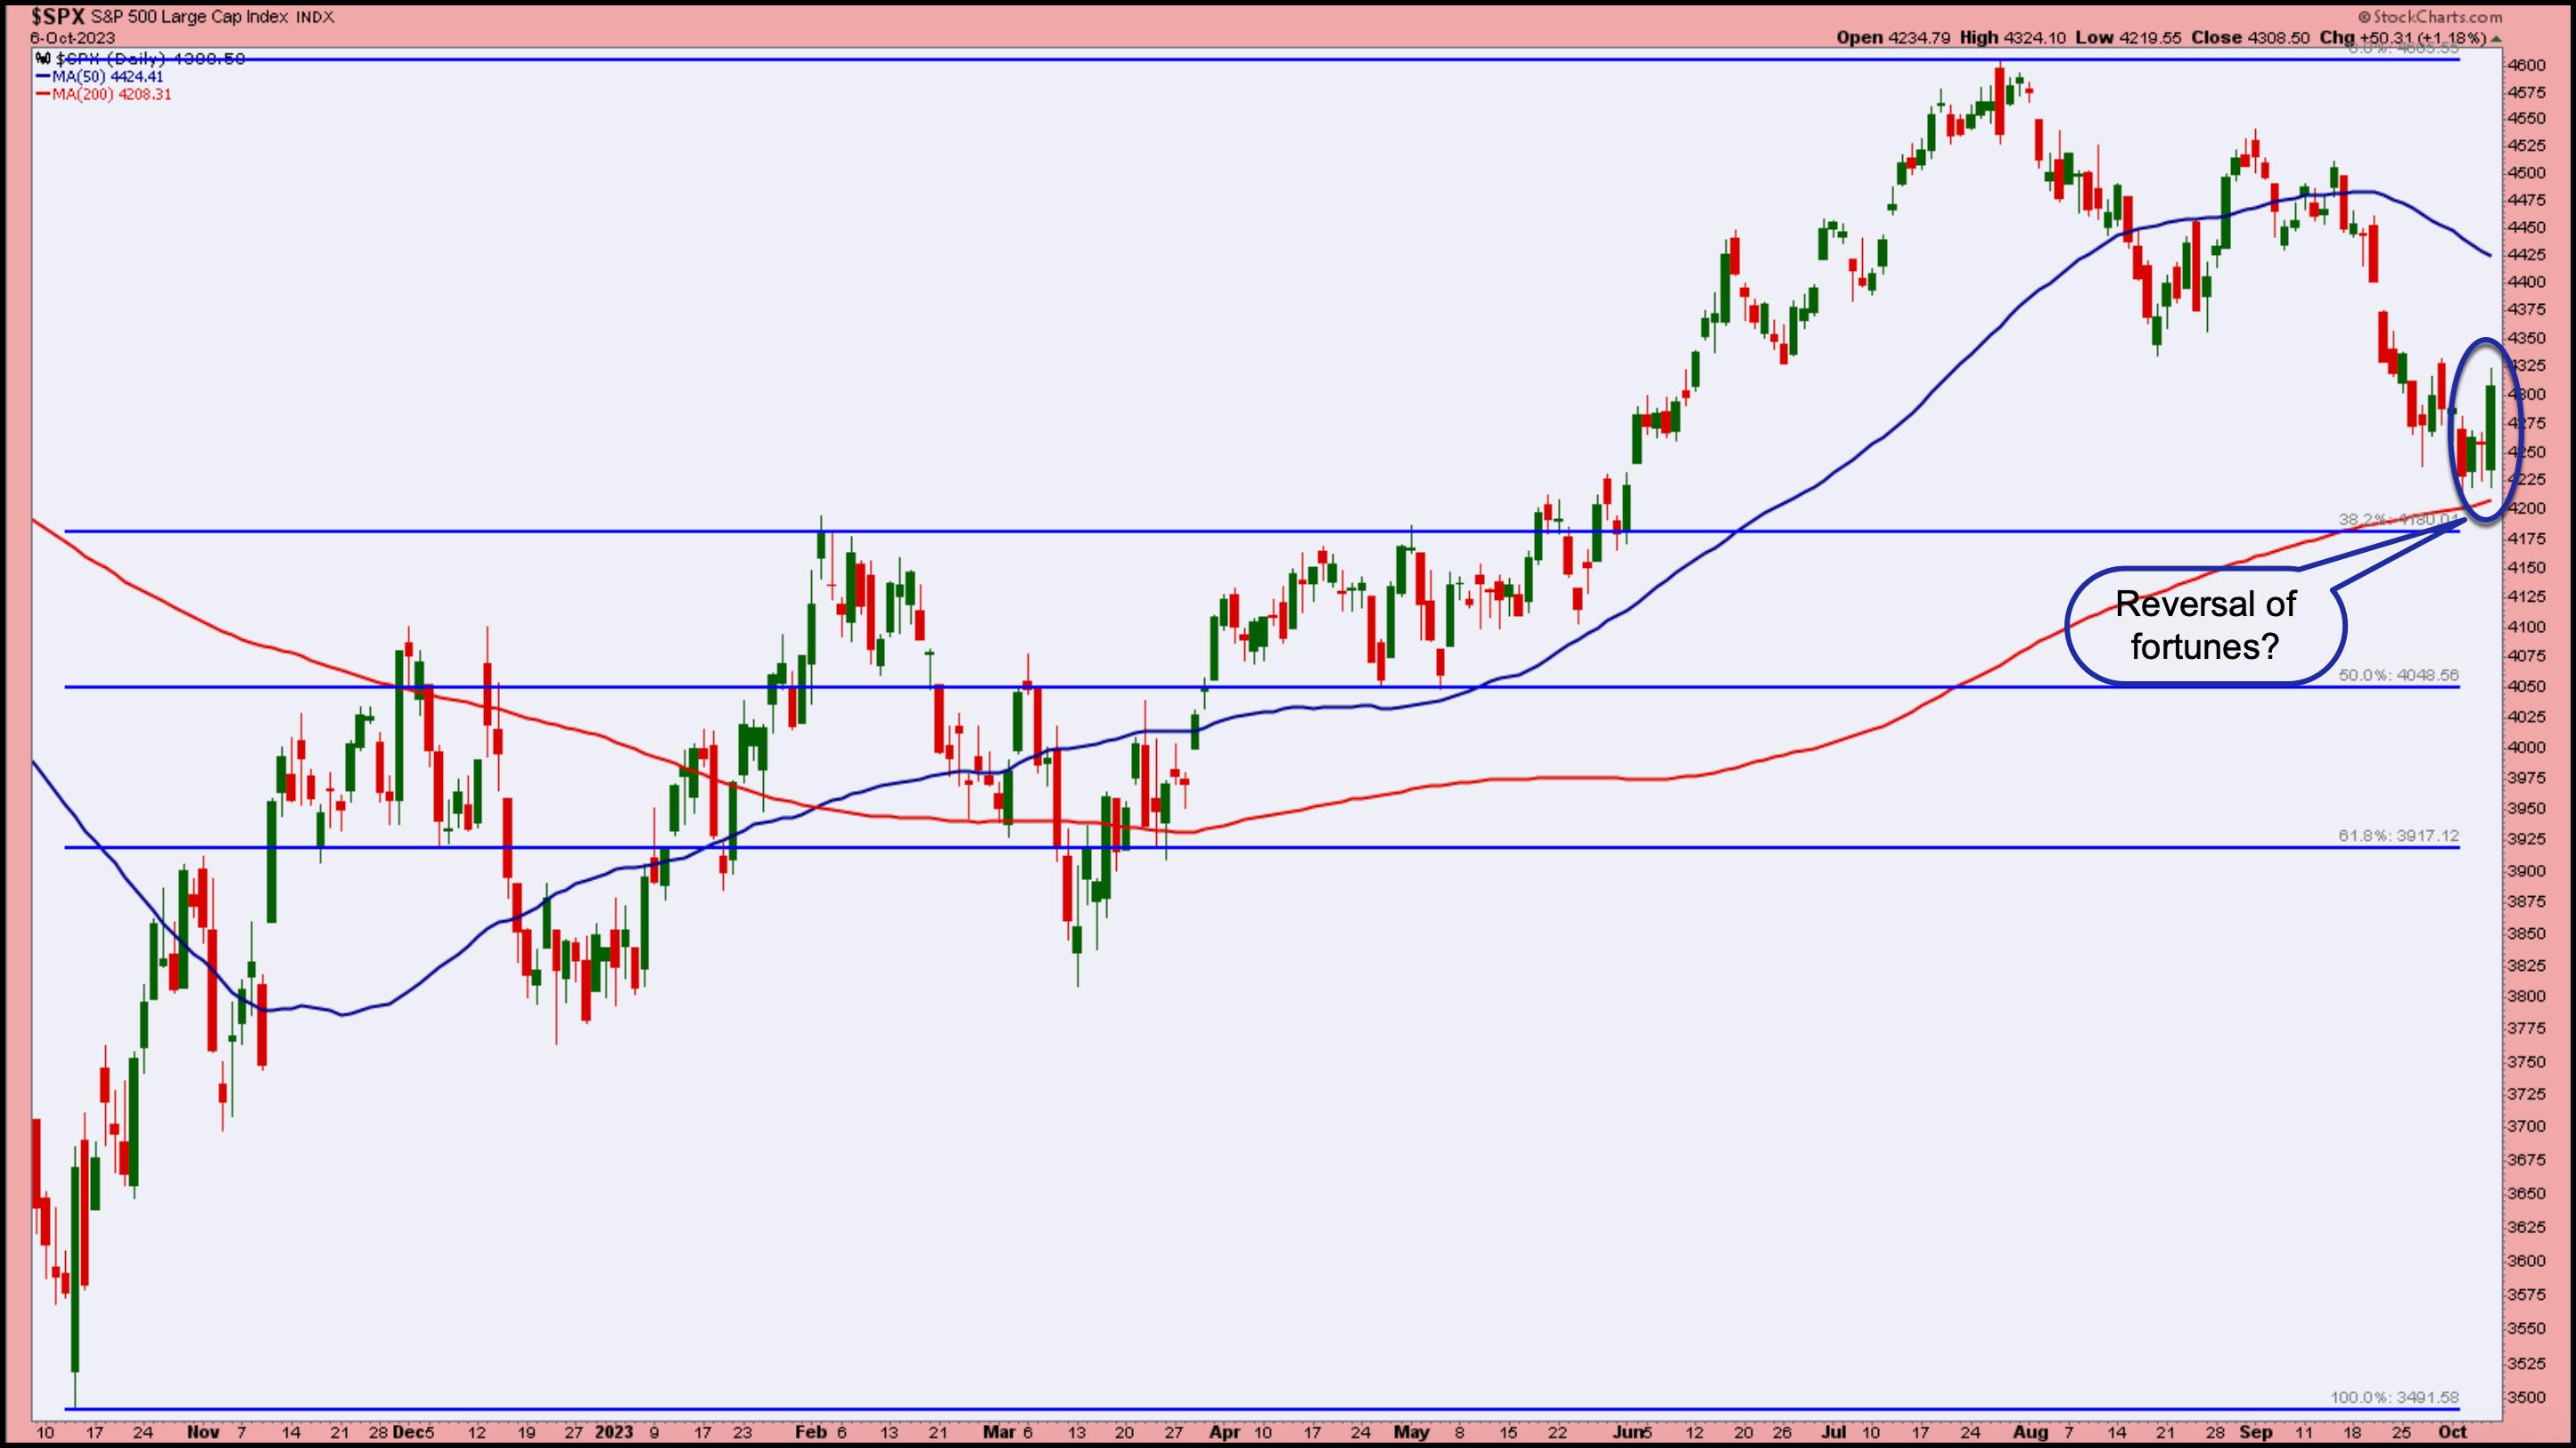
Keep an eye on the 4200 level in the S&P 500 index ($SPX). Before today, there was an obvious sideways movement going on just above the support of the 200-day moving average. The S&P 500 was also close to the first Fibonacci retracement level (from October 2022 lows to July 2023 highs).

CHART 1: S&P 500 INDEX BOUNCING OFF 200-DAY MOVING AVERAGE? One day doesn’t make a trend but the signs are encouraging. Chart source: StockCharts.com. For educational purposes.
Today’s price action was unexpected but shows how quickly the market can react. The S&P 500 moved away from its 200-day moving average and closed higher by over 1%. But that’s just a single day, and we still need to see higher highs and higher lows to be confident that the market has reversed. So, to protect your portfolio, it’s a good idea to analyze what could happen if the S&P 500 quickly moves lower in the next few trading days.
If the S&P 500 breaks below the 4200 level, it could fall much lower. That’s because, overall, the index is in a downtrend. Note the series of lower highs and lower lows. On the flip side, if the 4200 level holds and the index reverses and resumes its uptrend, there’s a chance it could hit its 50-day moving average and possibly hit the 4600 level it reached in July. But it’s still a way away from hitting that level. The index is much closer to its 4200 level support, and that’s where your focus should be. Since the overall trend is bearish, you’re better off being cautious.
Market Breadth: A More Accurate Barometer
Identifying market reversals can be tricky. When conditions are bearish, it’s best to adopt a wait-and-see approach. There are several indicators you can use to identify if the stock market has bottomed. One that can be effective is the Bullish Percent Index (BPI), which gives you some idea of the internal health of an index, sector, or industry group.
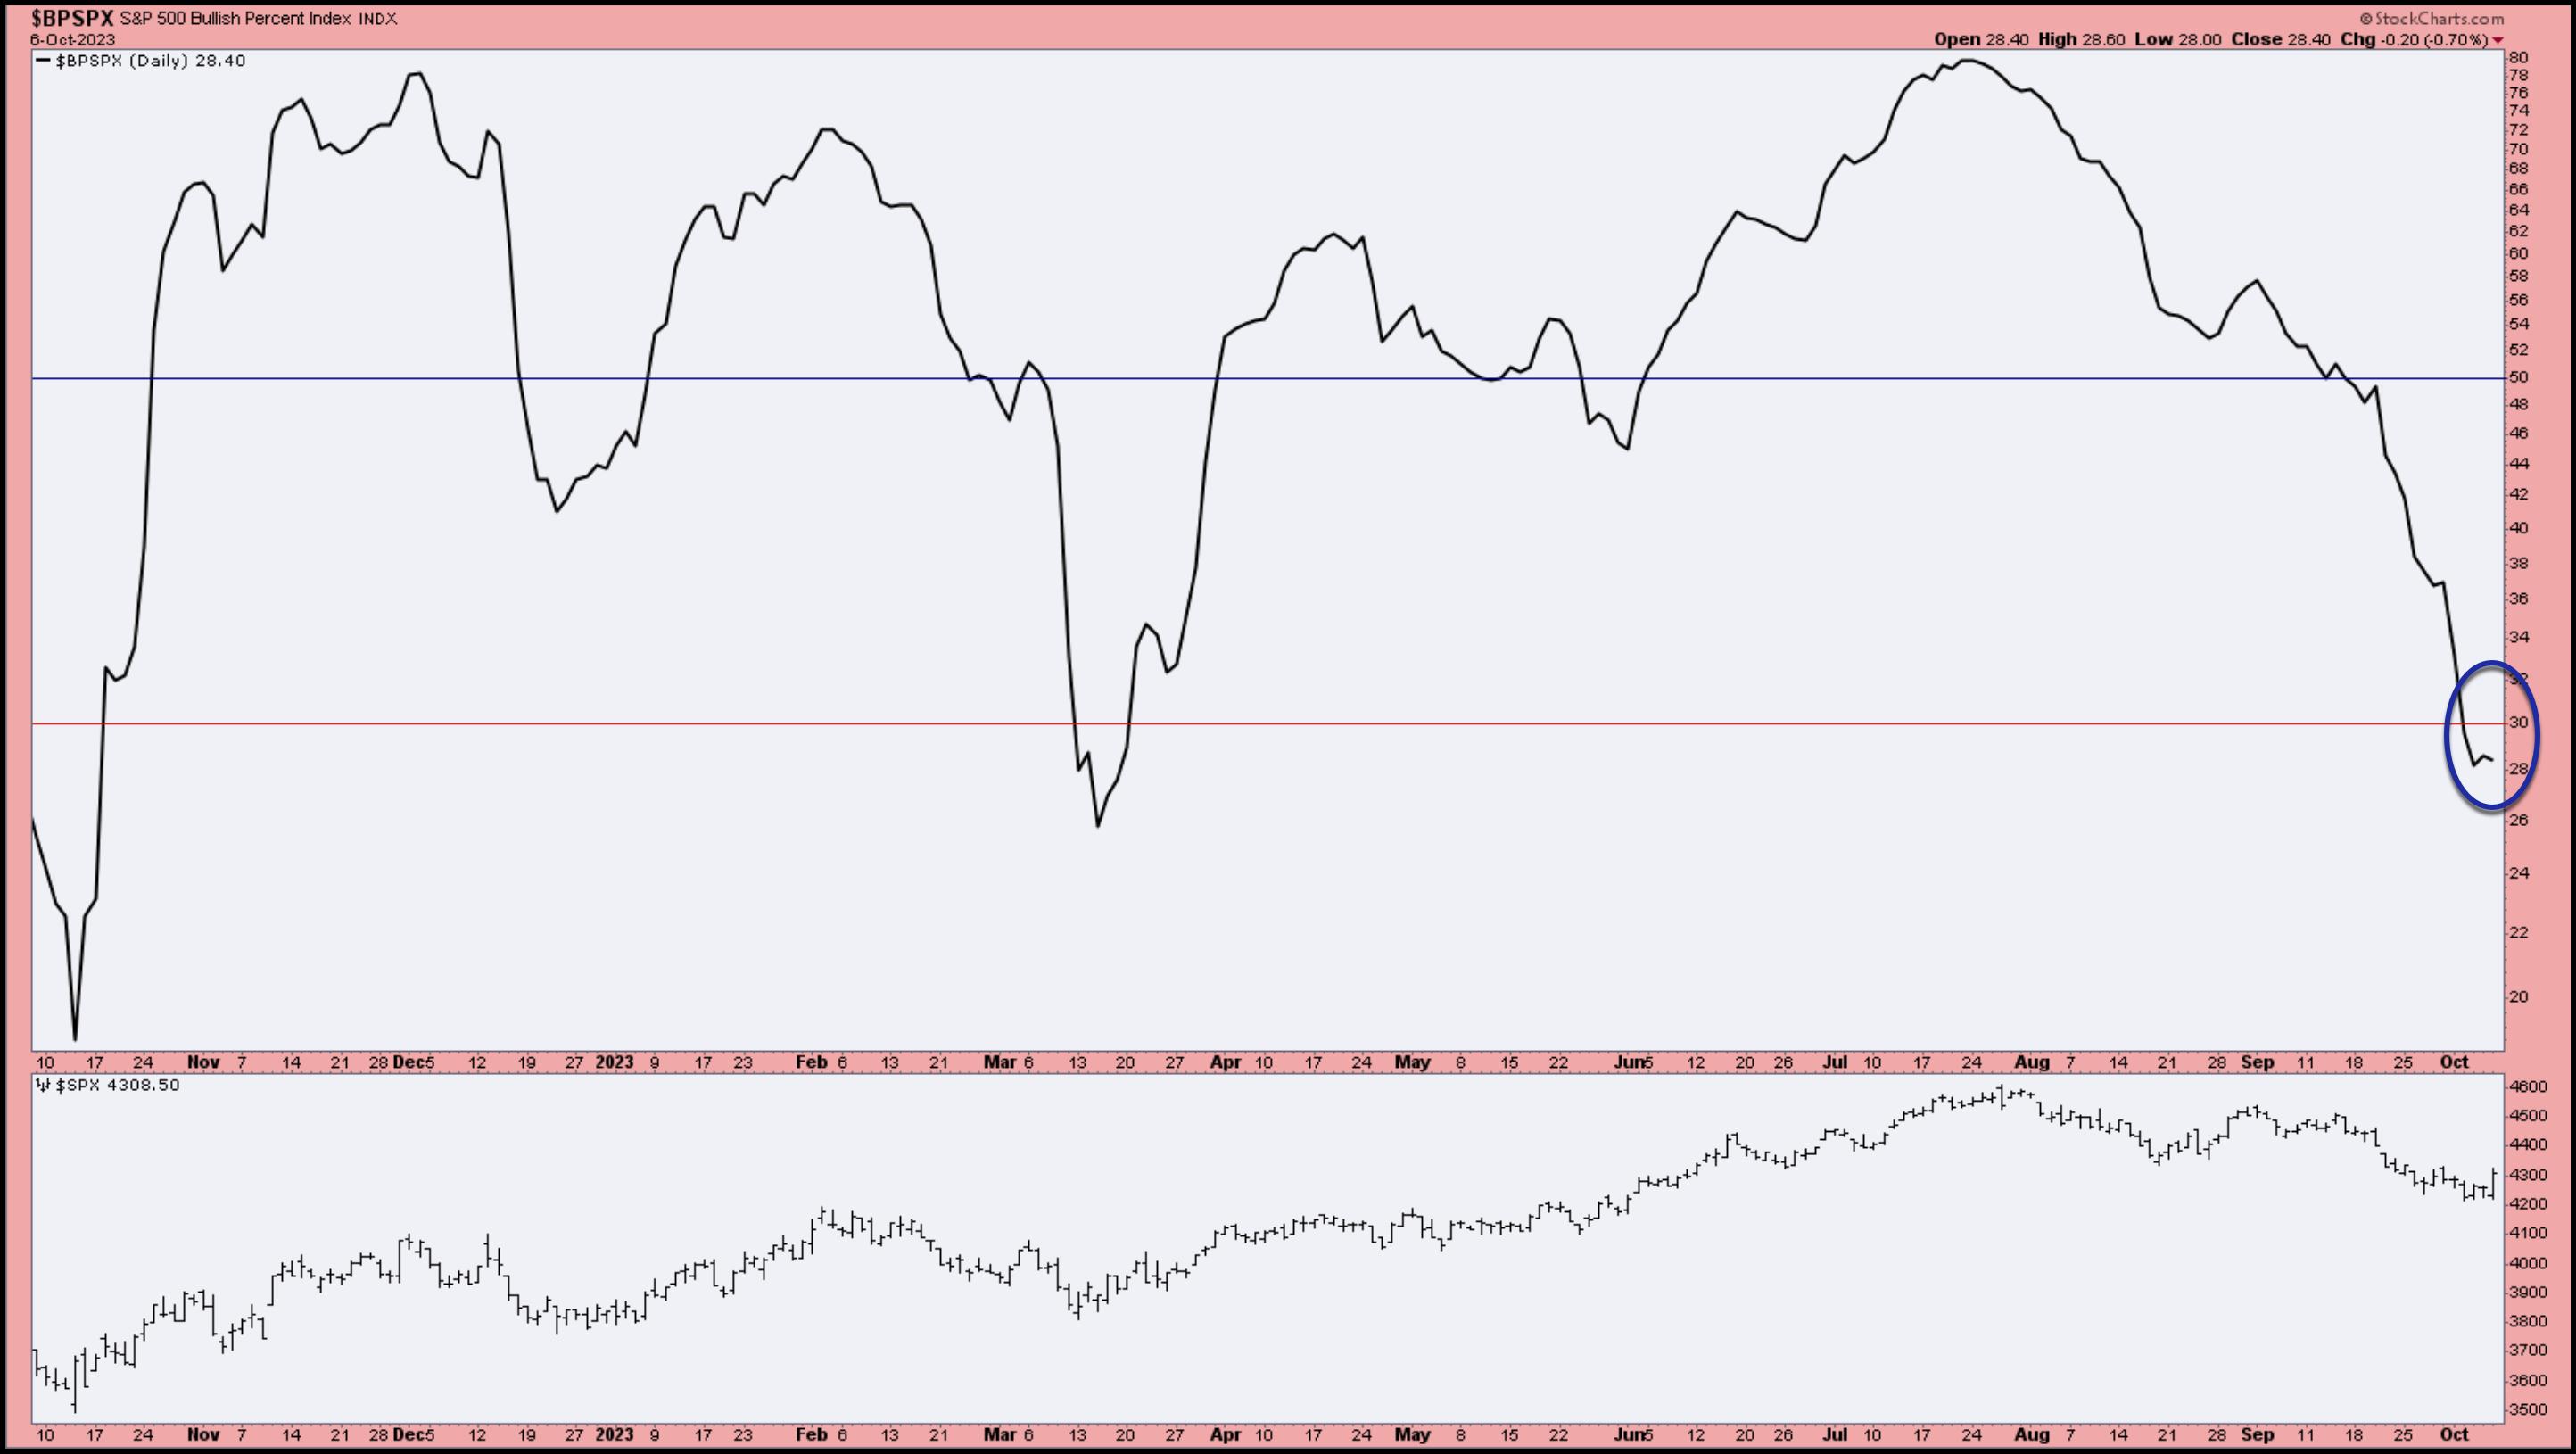
Starting with the S&P 500 BPI, you can see from the chart below that the indicator is below the 30 level, generally considered oversold. In the past year, there were two other times when the indicator dipped below 30—October 2022 and March 2023. Both these times, the S&P 500 fell to significant lows. Notice that the Bullish Percent Index turned relatively quickly, and when the indicator crossed above the 30 level, the S&P 500 went through a bullish rally.

S&P 500 BULLISH PERCENT INDEX IS STILL SHOWING A BEARISH SIGNAL. When the S&P 500 BPI turns and closes above the 30 level there’s a better chance that a reversal is in play. Chart source: StockCharts.com. For educational purposes.
It’s also worth looking at the BPI for some of the major indexes and sectors. Fortunately, StockCharts includes predefined CandleGlance charts, which can help you identify areas of the market that are gaining strength. Looking at the charts, Technology and Communication Services are the stronger sectors. And if you look at the Nasdaq BPI and the Nasdaq 100 BPI, you’ll see that they haven’t crossed below 30. So, assuming conditions don’t change drastically, these areas of the market are likely to lead the rally. That’s not surprising, given that’s been the narrative since the AI boom started.
A Surprising Sector Find
One point to keep in mind is the number of stocks that comprise the index or sector can impact how much the BPI moves. For example, the Dow Jones Industrial Average ($INDU) is made up of 30 stocks, while the S&P 500 has 500 stocks. So the DJIA BPI will visit oversold and overbought levels less frequently than the SPX BPI, and you might find some surprises.
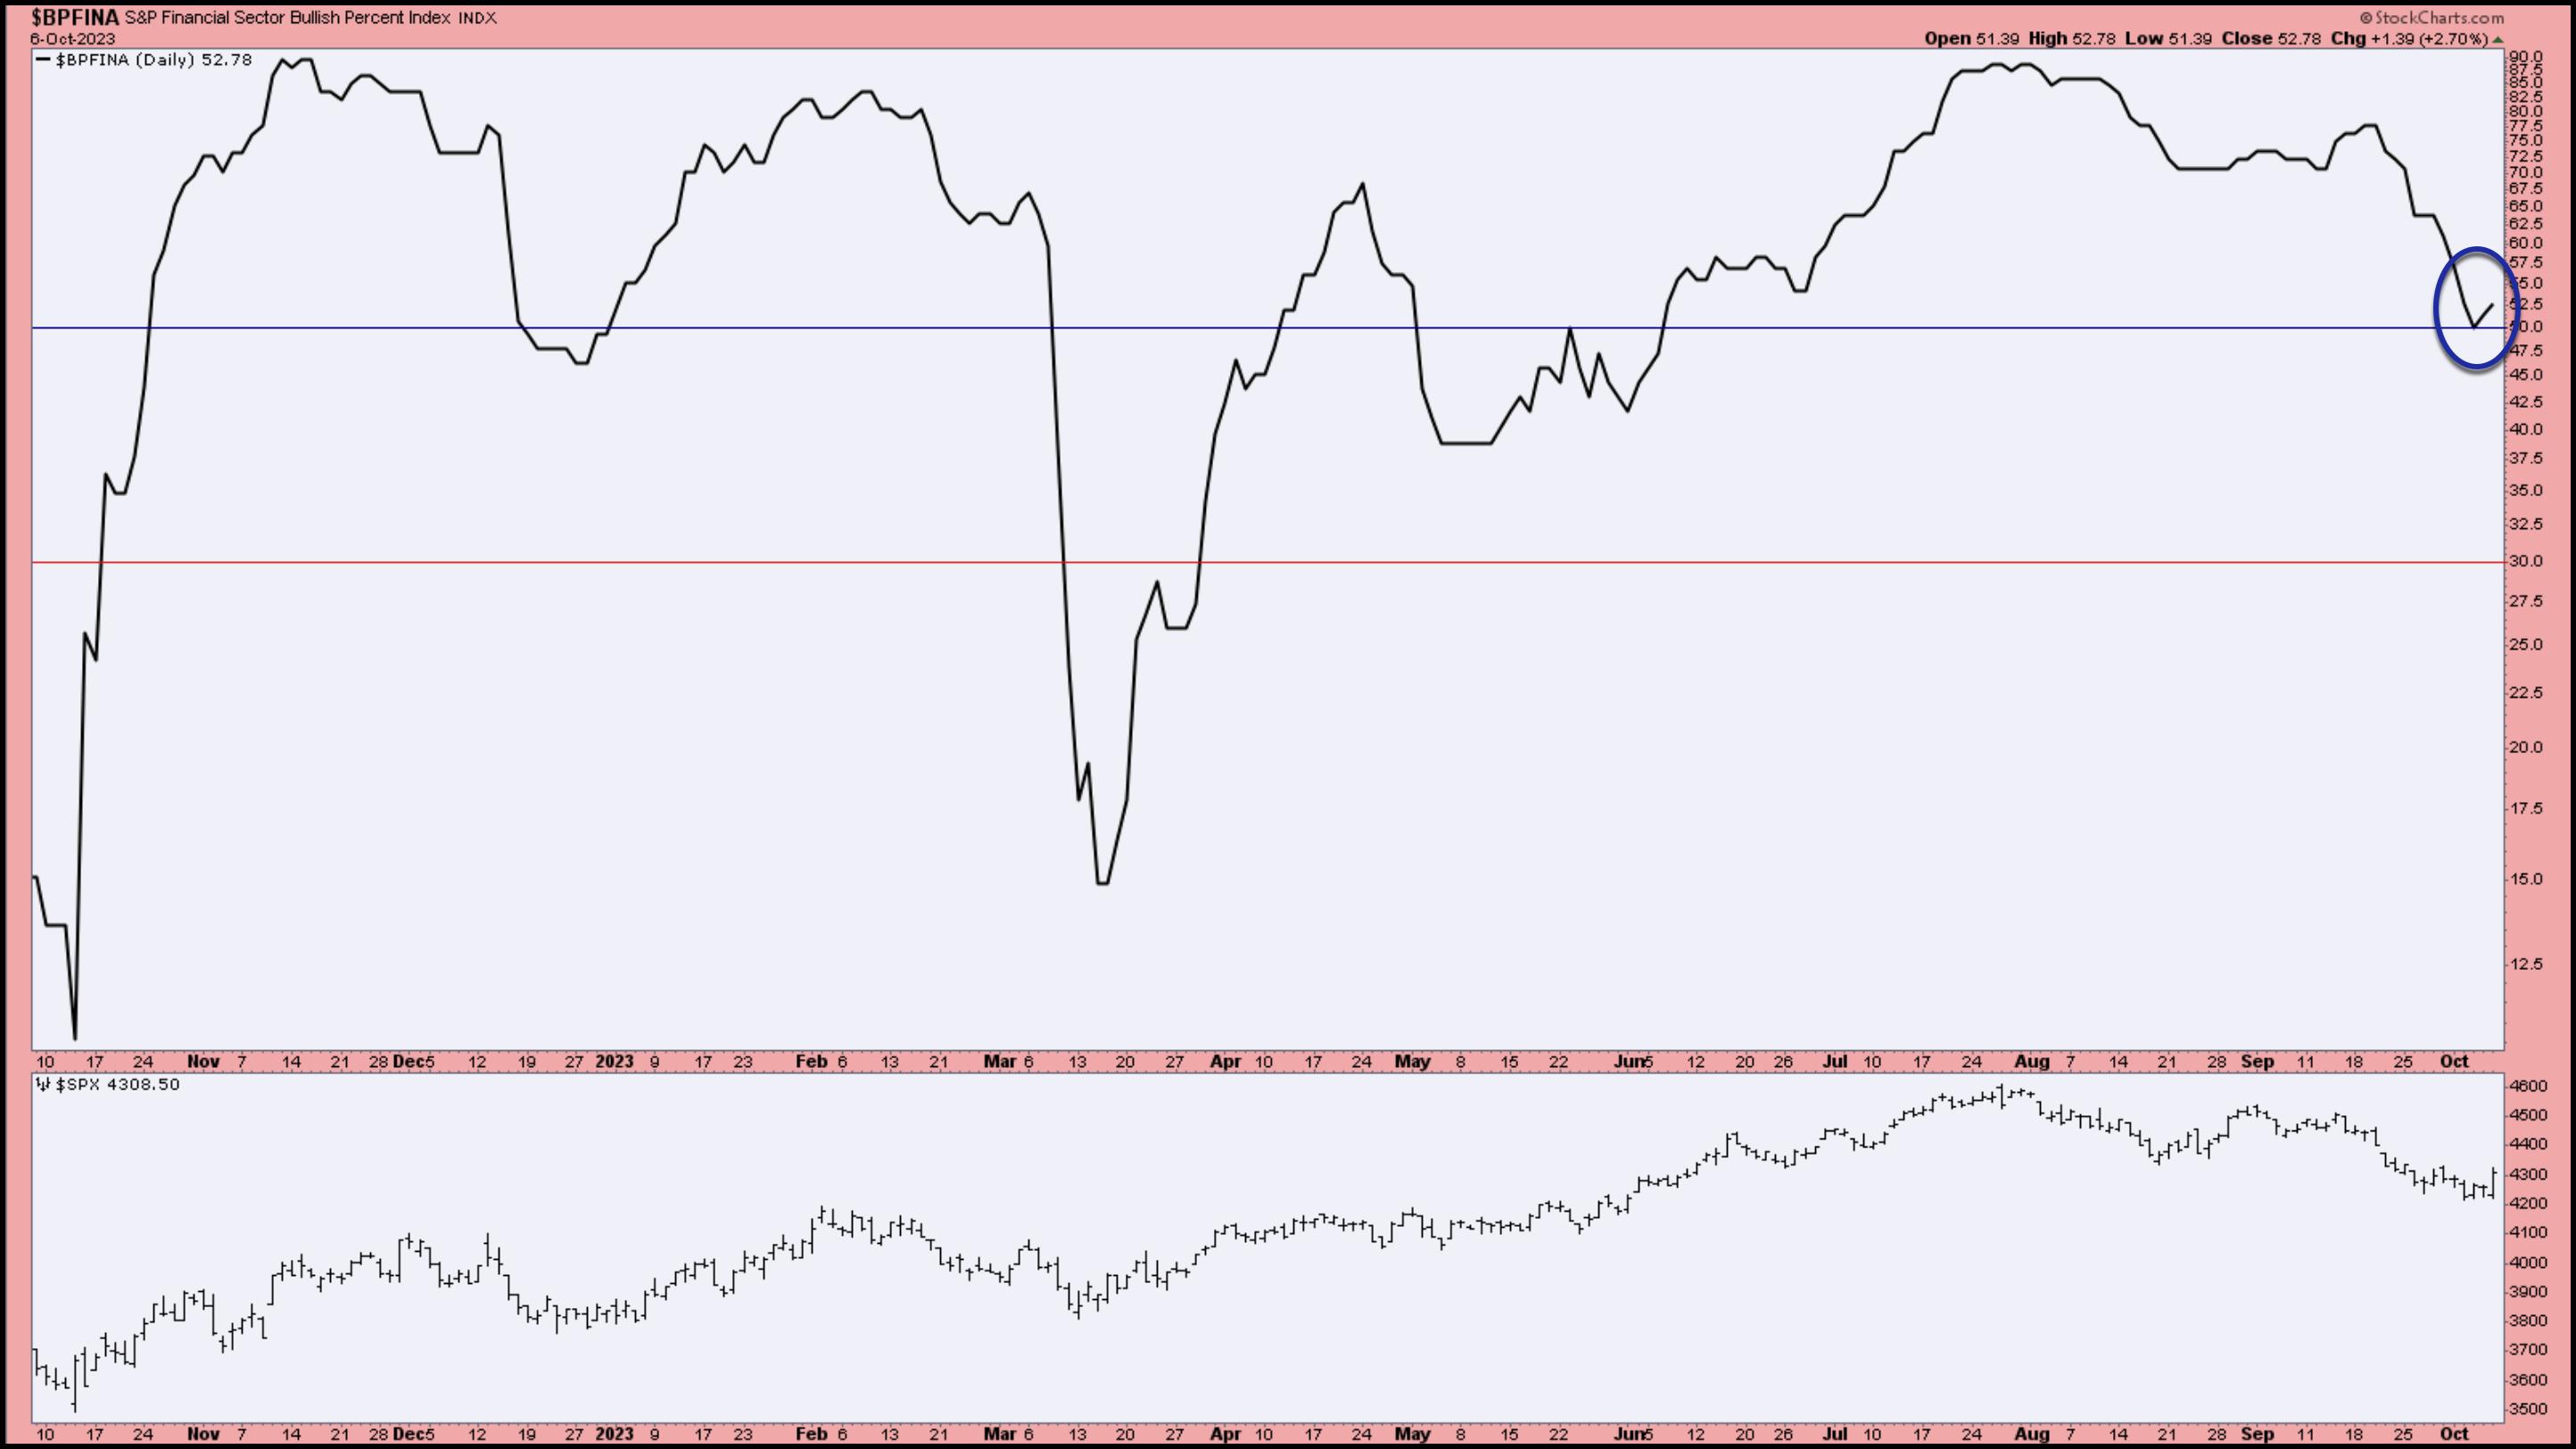
For example, the action in the Financial BPI (see chart below) will make you take a second look. For a sector that got hit hard, it was surprising to find the indicator bouncing off its 50 level. It may be worth bringing up a chart of the Financial Select Sector SPDR Fund (XLF). The ETF is in a downtrend, is well below its 200-day moving average, and is underperforming the S&P 500. But there’s one encouraging sign: its StockCharts Technical Rank (SCTR) score is crossing 70.

CHART 3: S&P FINANCIAL SECTOR BULLISH PERCENT INDEX. The financial sector looks like it’s bouncing off its 50 level. Does this mean it’s a good time to load up on beaten-down financial stocks? One day’s spike isn’t convincing enough but keep an eye on this indicator. A follow-through to the upside could mean financial stocks may rally soon. Chart source: StockCharts.com. For educational purposes.
Final Thoughts
So, with a BPI bouncing off 50 and a SCTR score crossing 70, is it possible that something is brewing in the Financial sector? Well, the big banks kick off earnings season next week. And Q3 earnings reports could be the catalyst that brings life to the equity market.
Lots of things that could be critical are happening next week in the stock market. Don’t stray too far from what’s going on.
Stock Market Wrap-Up
US equity indexes up; volatility down

- $SPX up 1.18% at 4308.50, $INDU up 0.87% at 33407.58; $COMPQ up 1.6% at 13431.34
- $VIX down 5.62% at 17.45
- Best performing sector for the week: Technology
- Worst performing sector for the week: Energy
- Top 5 Large Cap SCTR stocks: Vertiv Holdings, LLC (VRT); Super Micro Computer, Inc. (SMCI); Applovin Corp. (APP); Palantir Technologies (PLTR); Splunk Inc. (SPLK)
On the Radar Next Week
- Earnings Season kicks off with PepsiCo Inc. (PEP), Delta Airlines Inc. (DAL), Citigroup Inc. (C), and J.P. Morgan Chase & Co. (JPM), Wells Fargo & Co. (WFC)
- September PPI
- September CPI
- Fed speeches
Disclaimer: This blog is for educational purposes only and should not be construed as financial advice. The ideas and strategies should never be used without first assessing your own personal and financial situation, or without consulting a financial professional.

