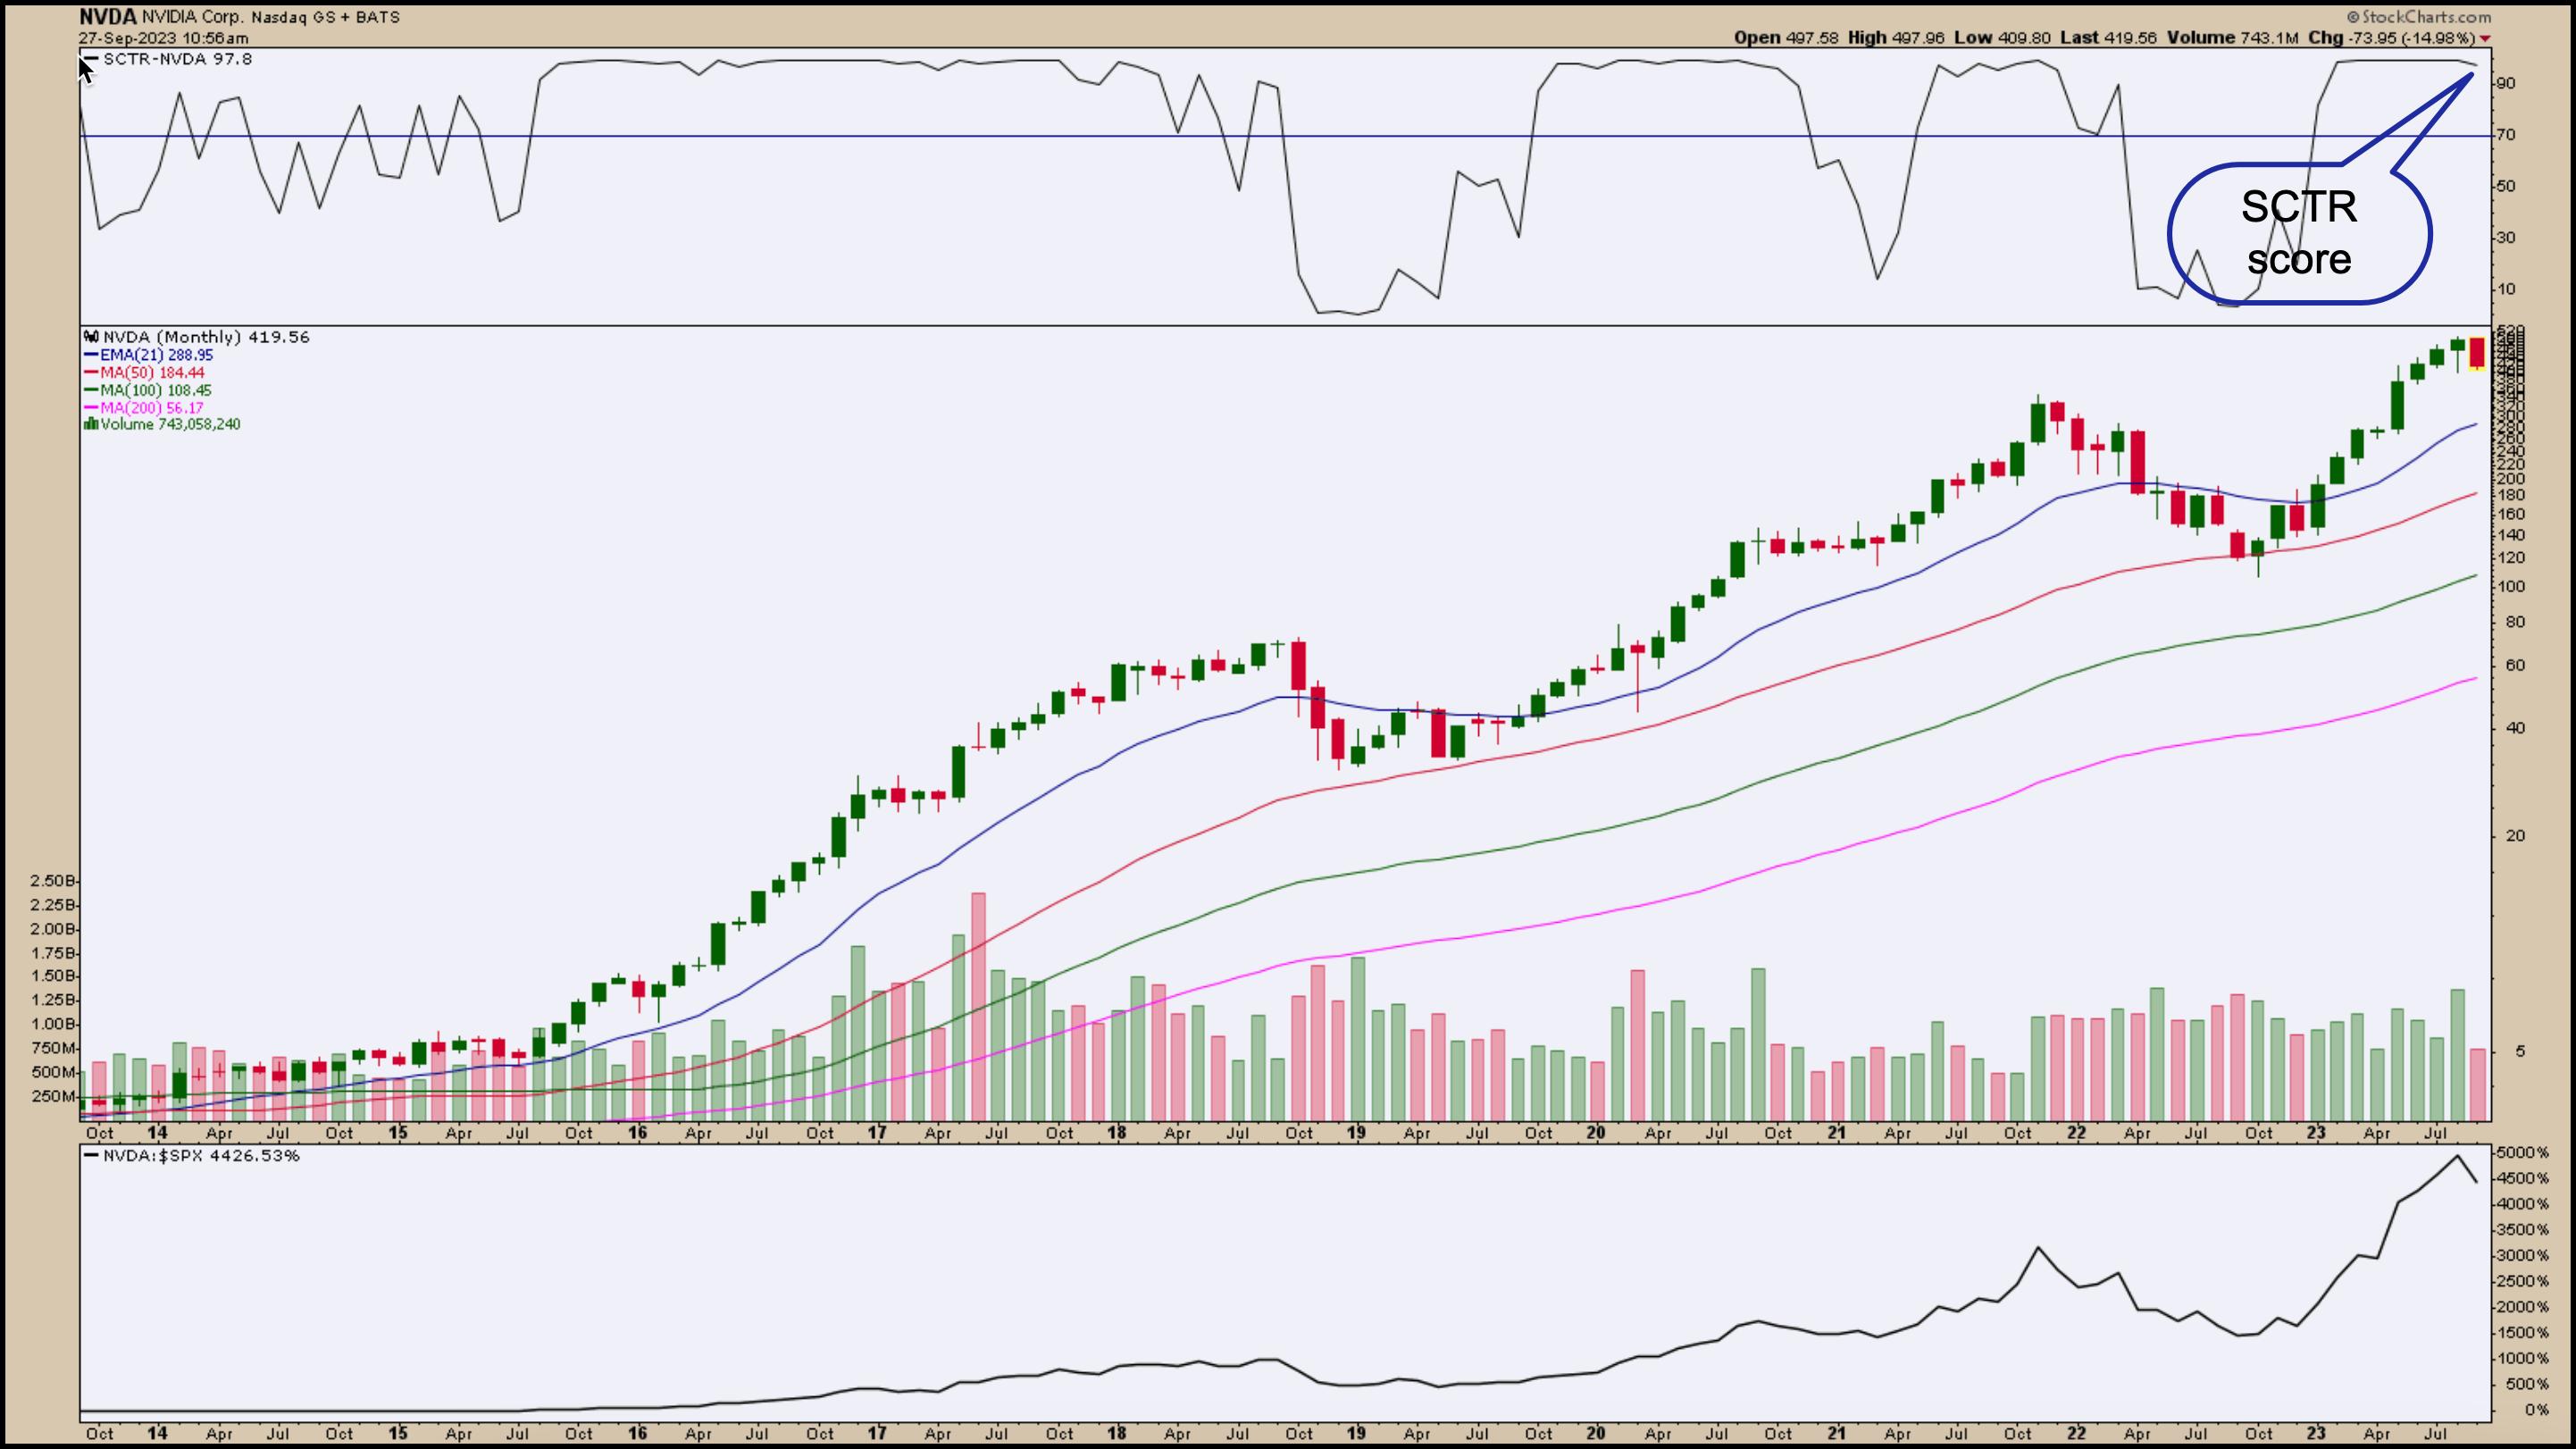
Nvidia’s stock has maintained a high StockCharts Technical Ranking (SCTR) score since early 2023. If you had bought the stock when it was less than $200 and continued holding it, you’d have made over a 100% return.
When the stock market trends lower, it will pull most stocks down. And when you have a stock like NVDA, which has a huge AI exposure and a massive influence on the stock market’s rally, it’s only natural for the stock to pull back.
Pullbacks are a great time to go through your charts and create a list of stocks that you’d like to own to take advantage of a market reversal. Given that we are in a seasonally weak period, this is a perfect time to analyze your charts. It’s also a great time to see how the different sectors and sub-sectors have performed within the broader downtrend.
Which stocks within the sectors have been underperforming, and which ones show stability? This gives you an idea of which areas you want to be in when the market reverses, because, very likely, the stocks that are stable during a downtrend will turn around and lead the rally. NVDA is one such stock.
Analyzing NVDA
On the monthly chart of NVDA stock (see below), the stock has been trending higher with support of its 50-month simple moving average.

CHART 1: MONTHLY CHART OF NVDA STOCK. Looking at a 10-year monthly chart, the stock has been steadily trending upward, with the 50-month moving average (red line) acting as a support level.Chart source: StockCharts.com. For educational purposes.
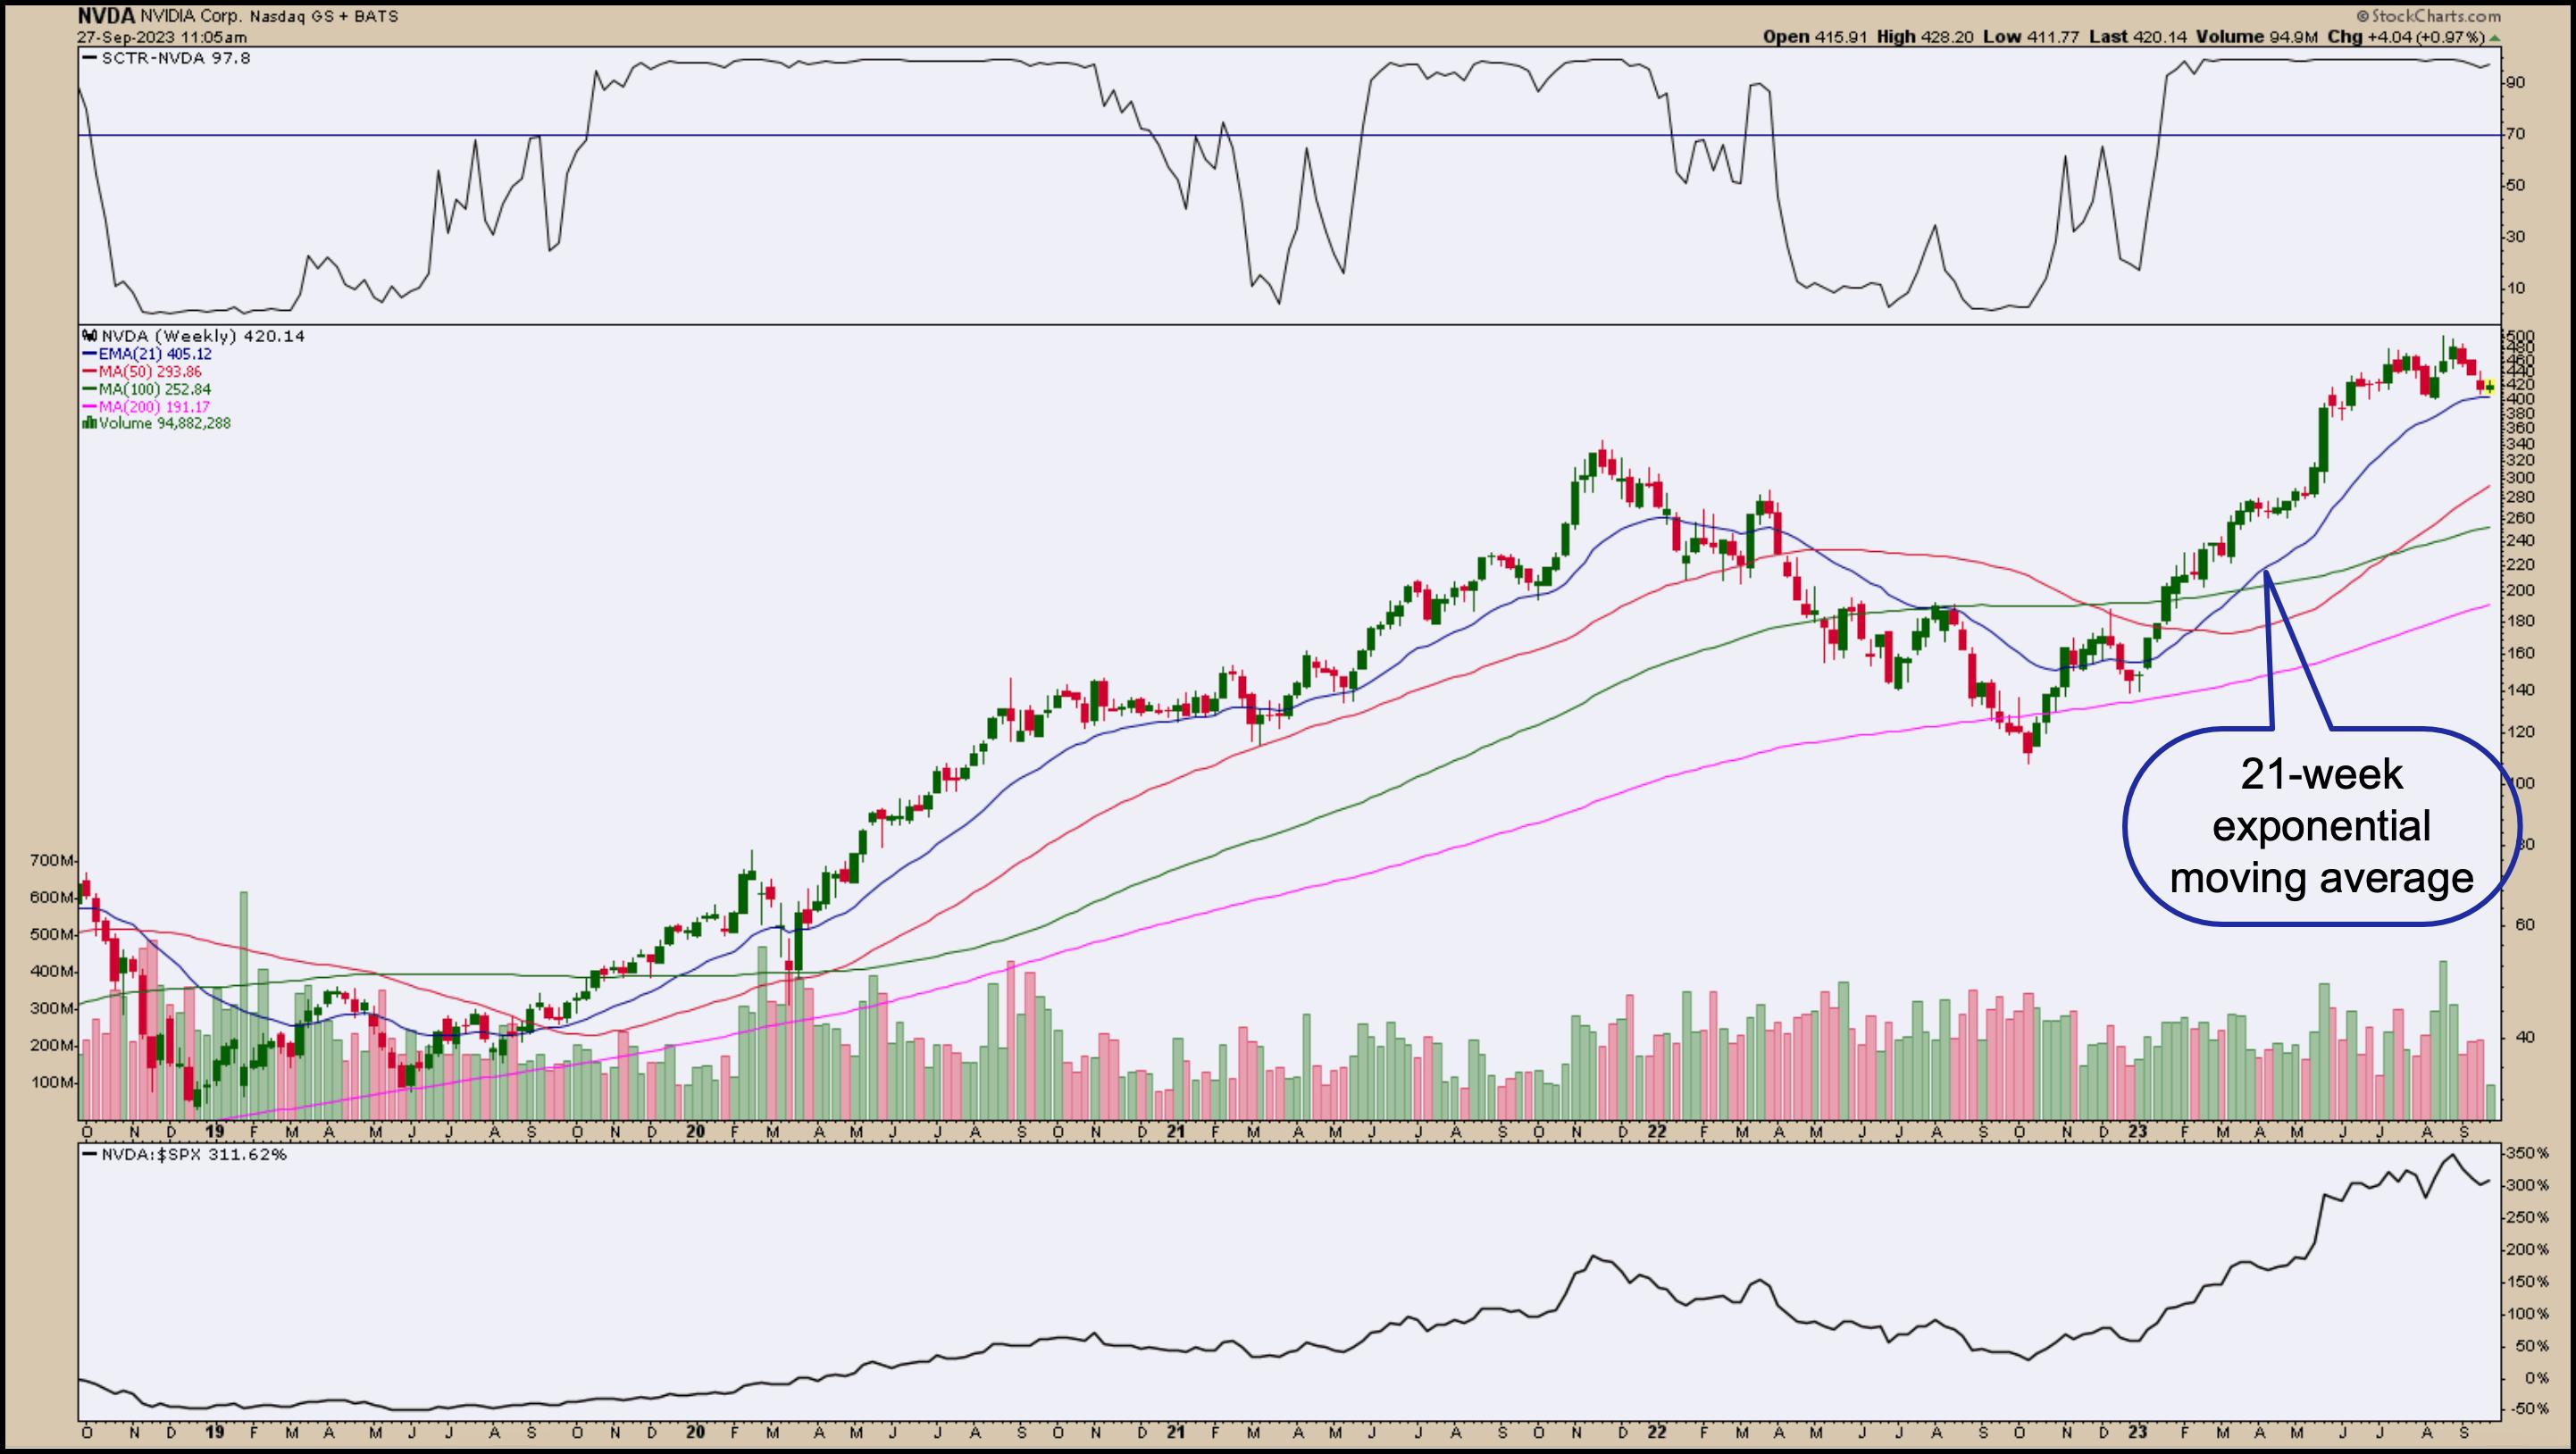
Technically, the stock looks strong, even though the broader market has faltered. The weekly chart also displays a positive picture. Since the October 2022 dip, when the price fell below the 200-week moving average, the stock has been trending higher, above its 21-week exponential moving average (EMA) — which is another positive for the stock. If it holds the 21-week EMA support and reverses from there on momentum, then it’s very likely the stock will rally.

CHART 2: WEEKLY CHART OF NVDA STOCK. Looking at the stock from a weekly perspective, it’s been riding up above its 21-week exponential moving average (blue line).Chart source: StockCharts.com. For educational purposes.
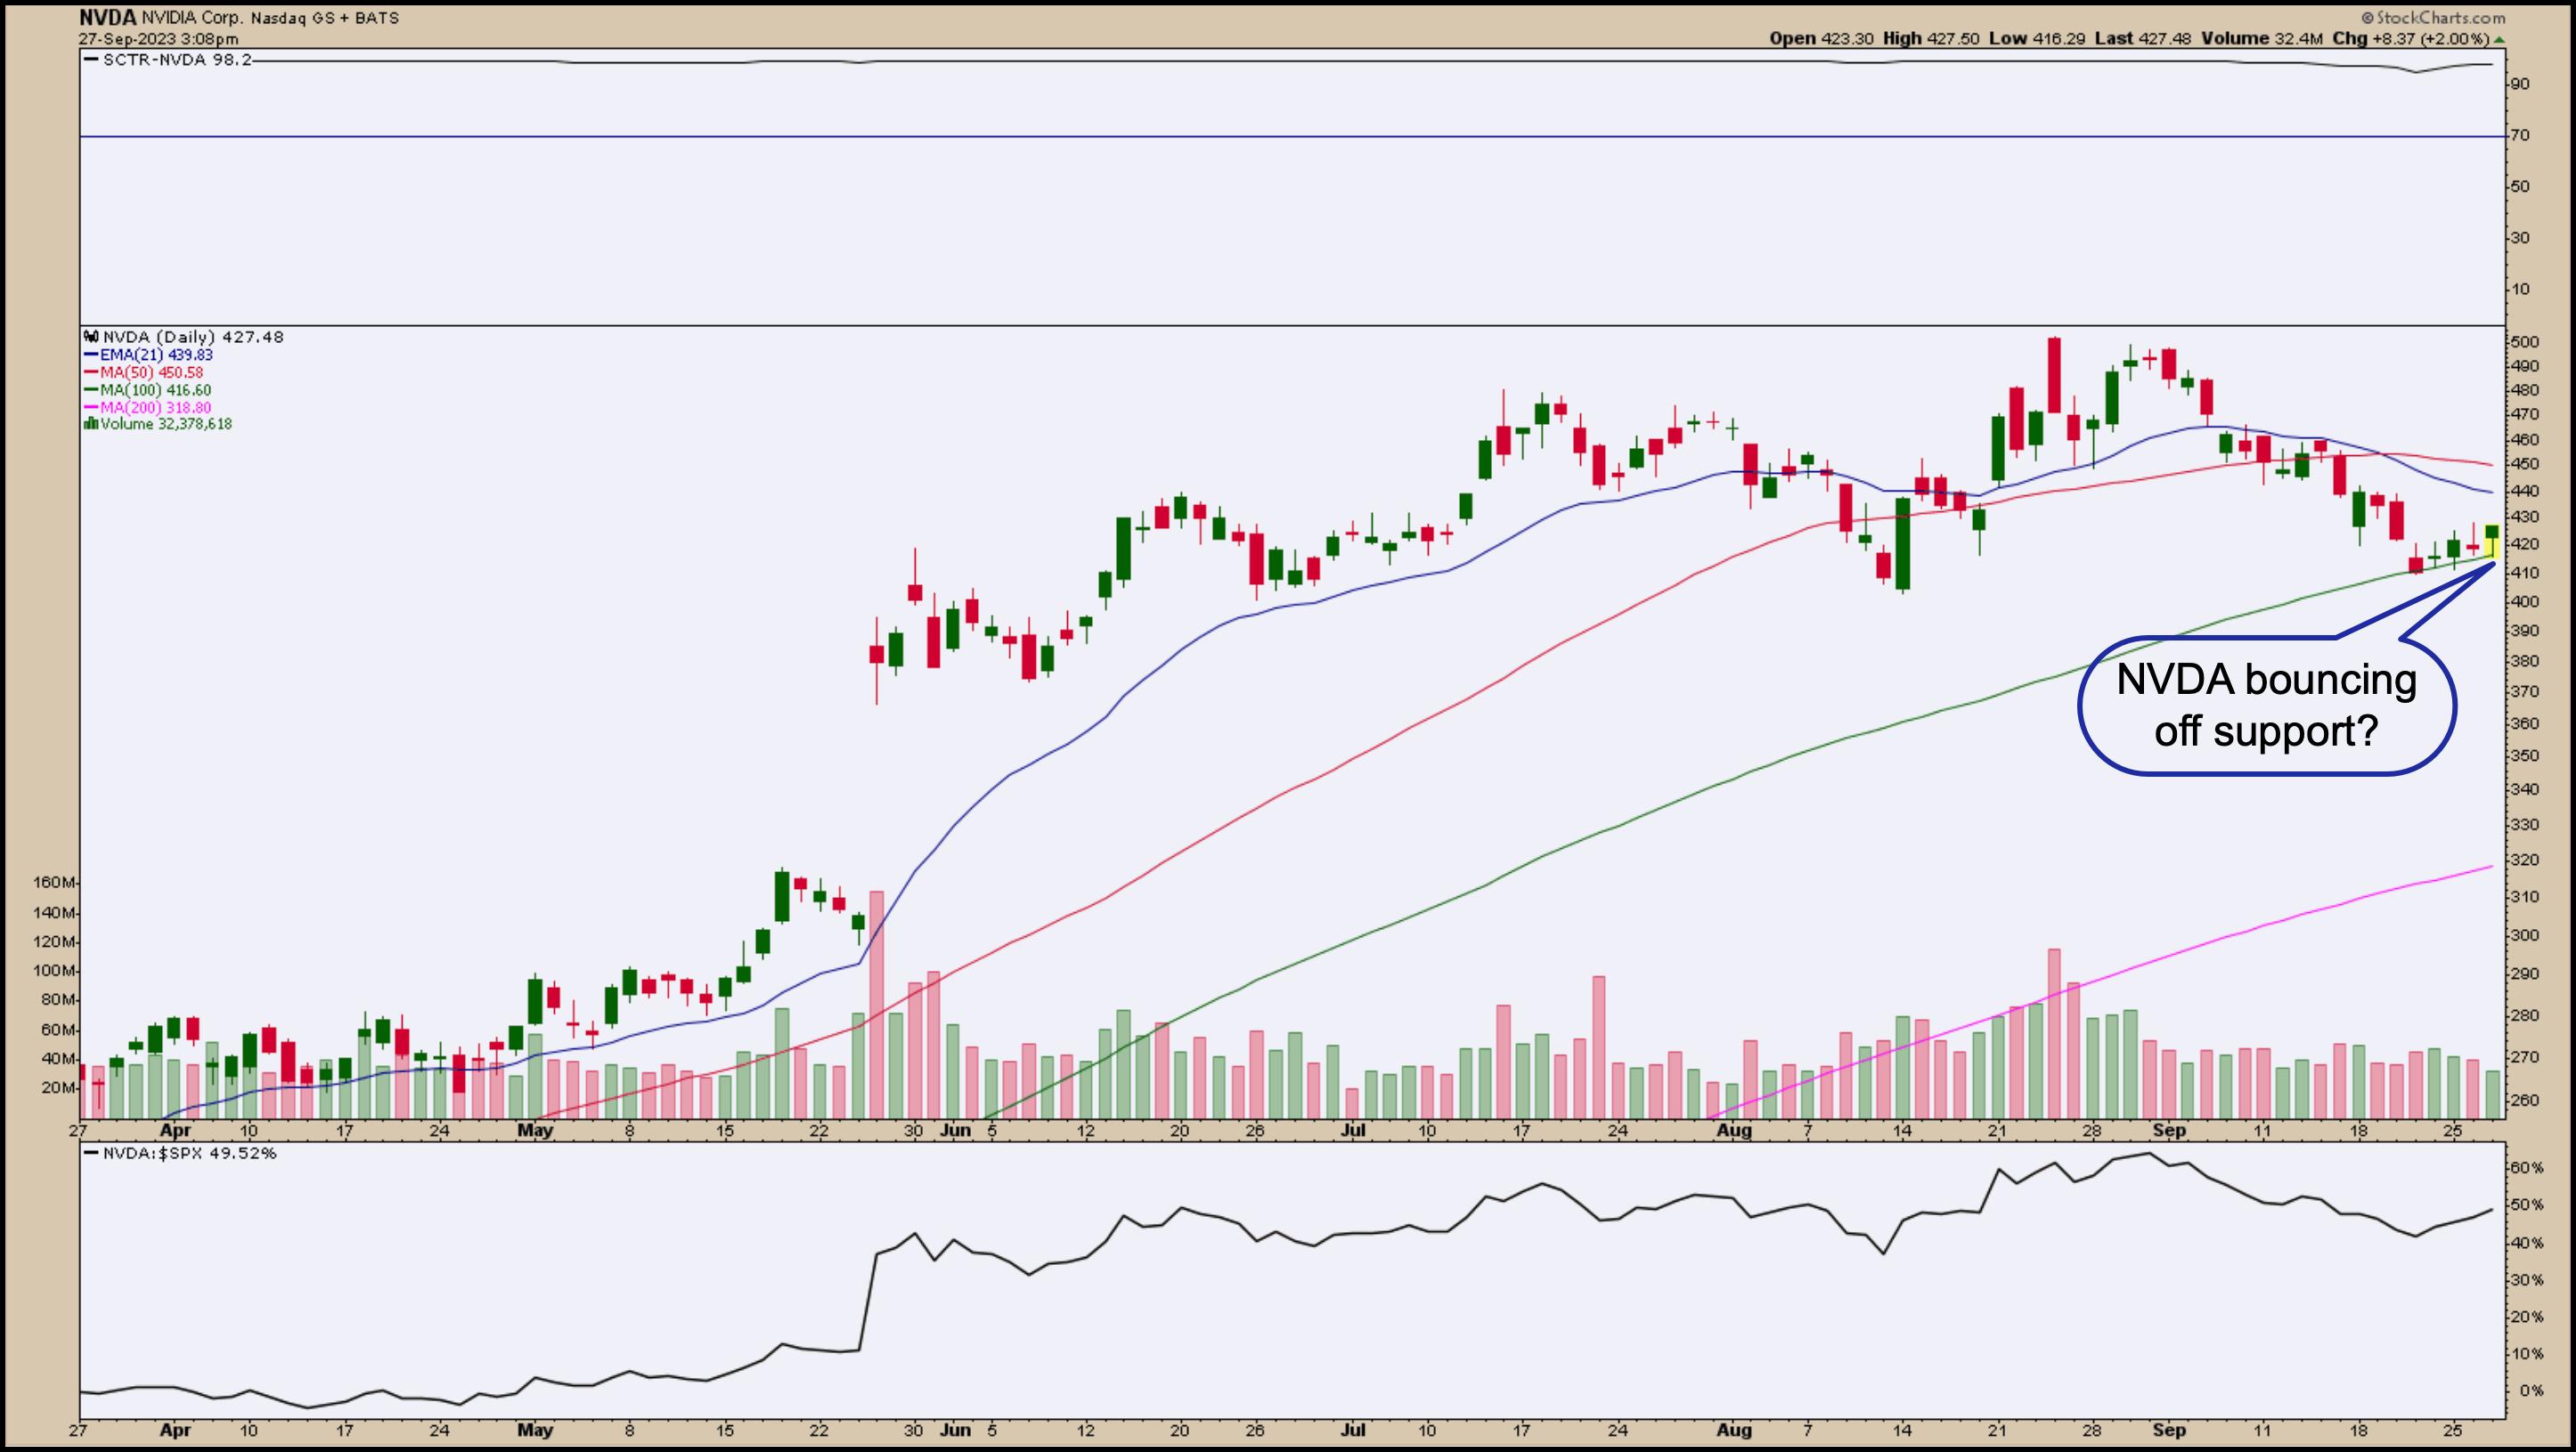
Even the daily chart looks positive. Sure, the stock pulled back, but it’s holding on to the support of its 100-day moving average (green line) with very narrow-range days. It’s almost as if it’s waiting for a catalyst before it explodes to the upside, which might be starting to take shape. With a SCTR score of 98 and relative strength with respect to the performance of the S&P 500 index approaching 50%, NVDA looks like a strong candidate that will lead the upswing when it happens.

CHART 3: ZEROING IN ON THE DAILY CHART OF NVDA. The stock is still strong. It has a SCTR score of almost 98, strong relative strength compared to the S&P 500, and is holding on to its 100-day moving average support. All indicate potential upside movement.Chart source: StockCharts.com. For educational purposes.
A Quick Way To View Multiple Time Frame Charts
- From Your Dashboard, under Member Tools, scroll down to Charting Tools and select GalleryView.
- Type in NVDA in the symbol box.
- By default, you’ll see an Intraday View, Daily View, Weekly View, and Point & Figure View.
- You can customize your GalleryView charts with indicators, overlays, and other settings using the ChartStyles feature.
Bottom Line
As long as the trend is bullish in all timeframes and NVDA’s stock price holds its 100-day MA support, this would be the stock to consider owning when the market shows signs of turning around. But at a price above $400, it may be rich for the average investor. So, as an alternative, consider investing in exchange-traded funds (ETFs) that are heavily weighted in NVDA, such as the VanEck Semiconductor ETF (SMH), iShares MSCI USA Quality Factor ETF (QUAL), and Global X Robotics & Artificial Intelligence Thematic ETF (BOTZ).

Disclaimer: This blog is for educational purposes only and should not be construed as financial advice. The ideas and strategies should never be used without first assessing your own personal and financial situation, or without consulting a financial professional.

